


Background summary
In the US data landscape, ensuring accurate, timely, and trustworthy analytics depends on robust data observability. Snowflake offers an all-in-one platform that simplifies monitoring data pipelines and quality without needing external systems.
This guide walks US data engineers through practical observability patterns in Snowflake: from freshness checks and schema change alerts to advanced AI-powered validations with Snowflake Cortex. Build confidence in your data delivery and accelerate decision-making with native Snowflake tools.
Introduction to data observability
Data observability is the proactive practice of continuously monitoring the health, quality, and reliability of your data pipelines and systems without manual checks. For US-based data teams, this means answering critical operational questions like:
- Is the daily data load complete and on time?
- Are schema changes breaking pipeline logic?
- Are key metrics stable or exhibiting unusual drift?
- Are these pipeline resources being queried as expected?
Replacing outdated scripts with automated, real-time observability reduces risk and speeds issue resolution.
Why Snowflake is the ideal platform for data observability in the US?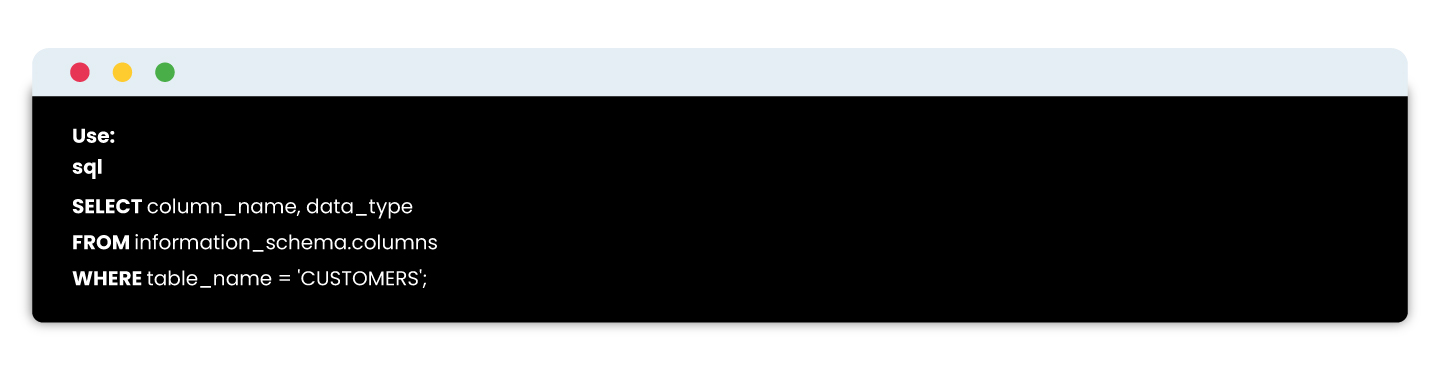
Snowflake’s unified architecture brings data storage, processing, metadata, and compute resources into one scalable cloud platform, especially beneficial for US enterprises with complex compliance and scalability requirements. Key advantages include:
- Direct access to system metadata and query history for real-time insights.
- Built-in Snowflake Tasks for scheduling observability queries without external jobs.
- Snowpark support to embed Python logic for custom anomaly detection and validation.
- Snowflake Cortex, a game-changing AI observability tool with native Large Language Model (LLM) integration for intelligent data evaluation and alerting.
- Seamless integration with popular US monitoring and communication tools such as Slack, PagerDuty, and Grafana.
These features empower US data engineers to build scalable observability frameworks fully on Snowflake.
Core observability patterns to implement in Snowflake
1. Data freshness monitoring
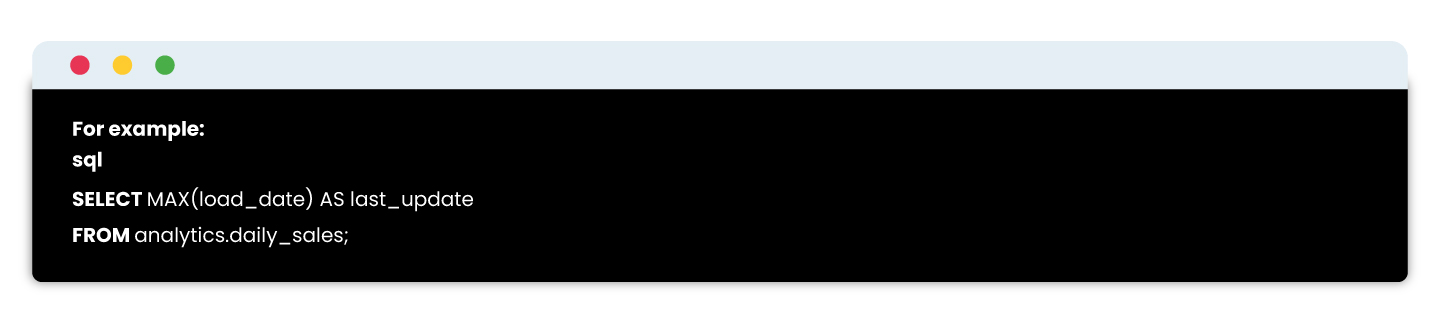 Verify that your critical tables update as expected daily with timestamp comparisons.
By scheduling this as a Snowflake Task and logging results, you catch delays early and comply with SLAs vital for US business responsiveness.
2. Trend monitoring with row counts
Sudden spikes or drops in row counts can signal data quality issues. Collect daily counts and compare to a rolling 7-day average. Use Snowflake Time Travel to audit past states without complex bookkeeping.
3. Schema change detection
Changes in table schemas can break consuming applications.
Snapshotted regularly, this helps detect unauthorized or accidental alterations.
4. Value and distribution anomalies via Snowpark
Leverage Python within Snowpark to check data distributions and business logic rules, such as:
- Null value rate spikes
- Unexpected new categorical values
- Numeric outliers beyond thresholds
For US compliance or finance sectors, these anomaly detections support regulation-ready controls.
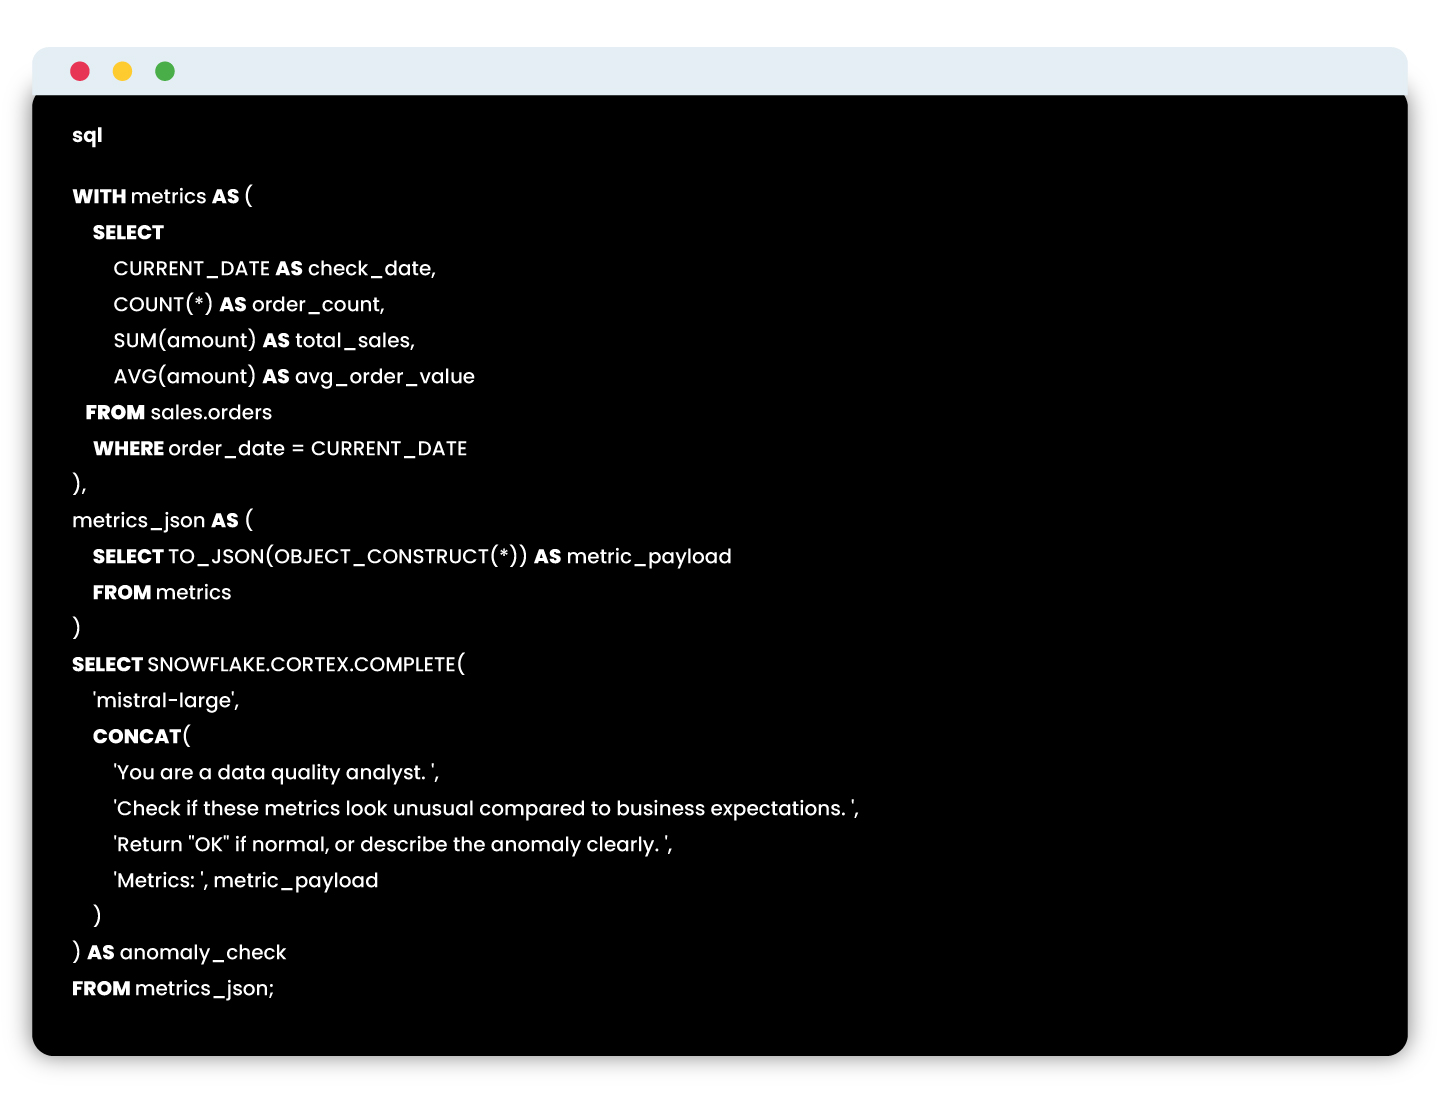
5. Advanced AI checks with Snowflake Cortex
 Snowflake Cortex enables embedding LLMs directly in SQL to evaluate complex data conditions naturally and intelligently.
This eliminates complex manual rules while providing human-like explanations for data integrity, rising in demand across US enterprises with AI-driven reporting .

How it works?
The basic idea is to leverage LLMs to evaluate data the way a human might—based on instructions, patterns, and past context. Here’s a deeper look at how this works in practice:
- Capture metric snapshots
You gather the current and previous snapshots of key metrics (e.g., client_count, revenue, order_volume) into a structured format. These could come from daily runs, pipeline outputs, or audit tables. - Convert to JSON format
These metric snapshots are serialized into JSON format—Snowflake makes this easy using built-in functions like TO_JSON() or OBJECT_CONSTRUCT(). - Craft a prompt with business logic
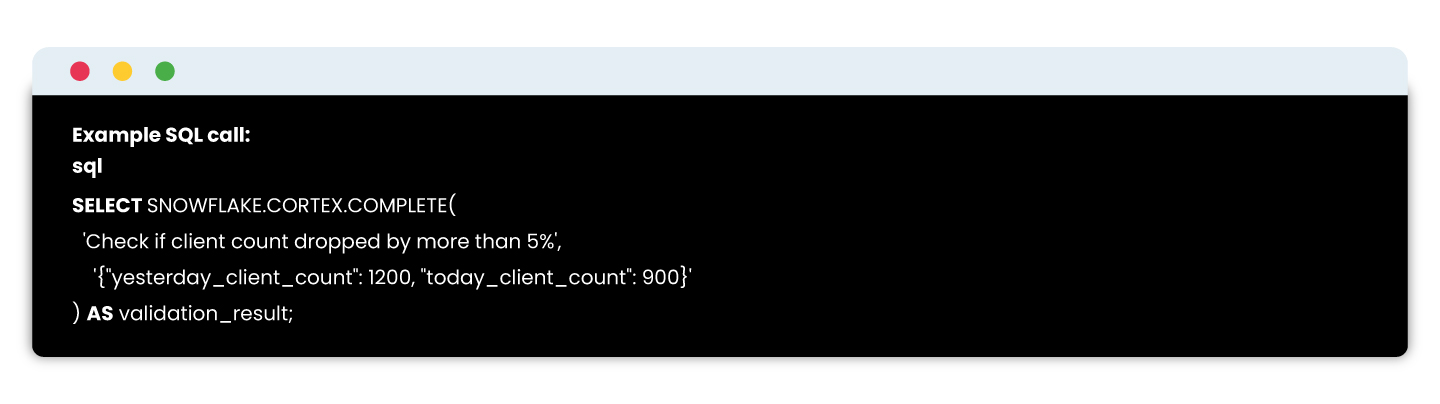
You design a prompt that defines the logic you’d normally write in Python or SQL. For example:

- Invoke the LLM using SQL
With Cortex, you can call the LLM right inside your SQL using a statement like:\
- Interpret the output
The response is a natural language or simple string output (e.g., ‘Failed’, ‘Passed’, or a full explanation), which can then be logged, flagged, or displayed in a dashboard.
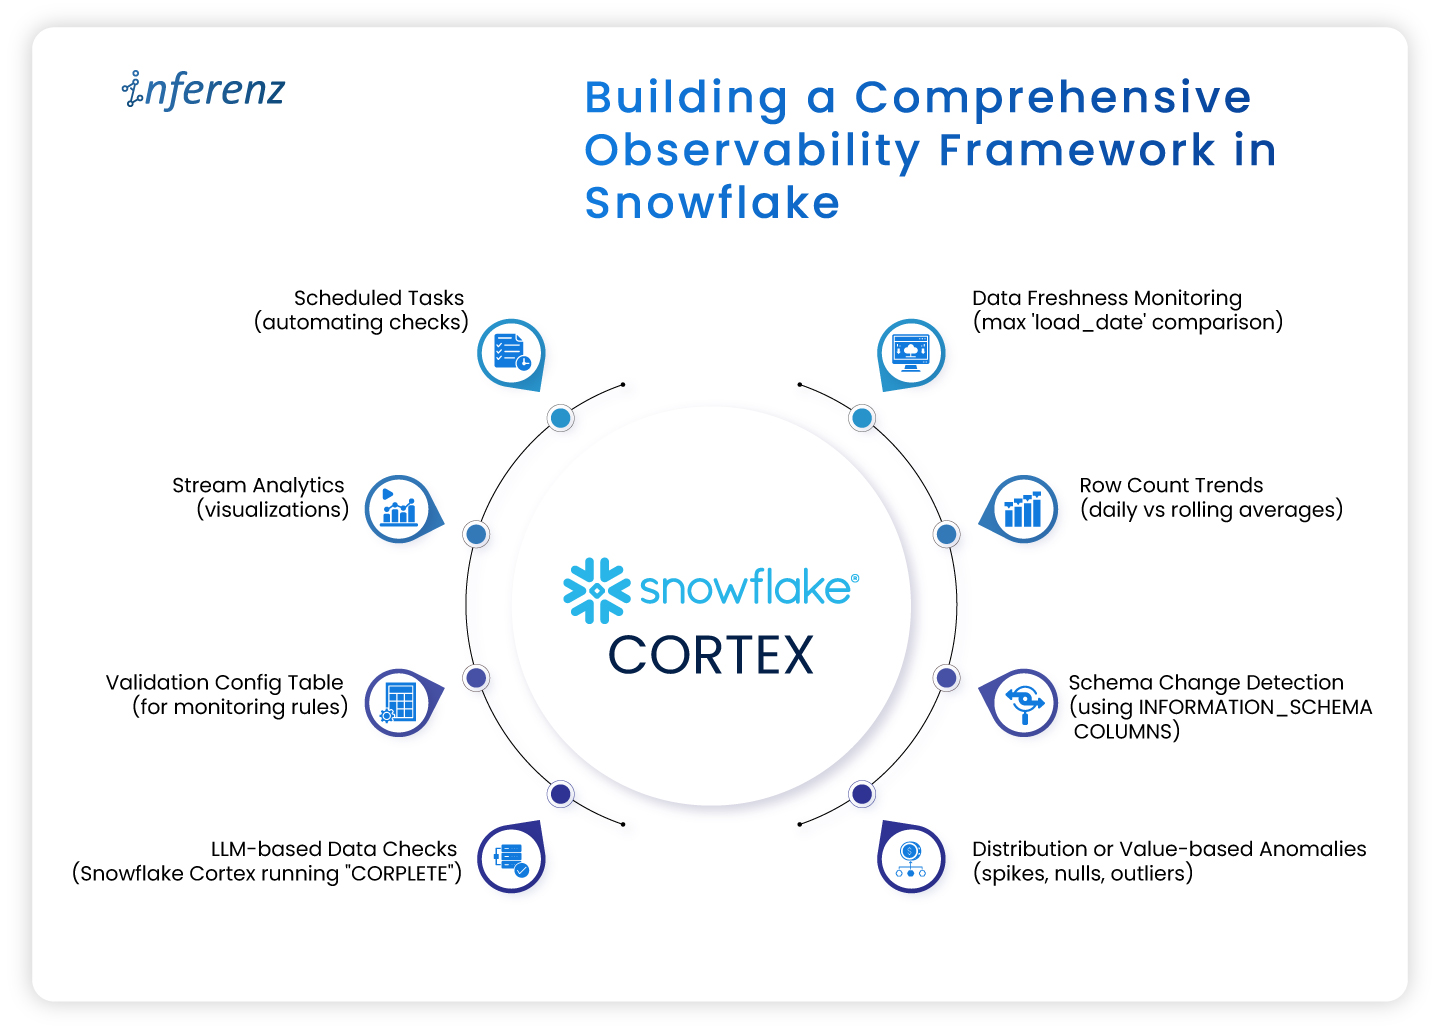
Building a comprehensive observability framework in Snowflake
A robust framework typically includes:
- Config tables defining what to monitor and rules to trigger alerts.
- Scheduled SNOWFLAKE Tasks to execute data quality checks and log metrics.
- Centralized metrics repository tracking historical results.
- Alert notifications routed to US-favored channels (Slack, email, webhook).
- Dashboards (via Snowsight, Snowpark-based apps, Grafana integrations) visualizing trends and failures in real-time.
Snowflake’s 2025 innovations such as Snowflake Trail and AI Observability increase visibility into pipelines, enhancing time-to-detect and time-to-resolve issues for US data teams.
Conclusion
Data observability is crucial for US data engineering teams aiming for trustworthy analytics and regulatory compliance. Snowflake provides an unparalleled integrated platform that brings together data, metadata, compute, and AI capabilities to monitor, detect, and resolve data quality issues seamlessly. By implementing the observability strategies outlined here, including Snowflake Tasks, Snowpark, and Cortex, data teams can reduce manual overhead, accelerate root-cause analysis, and ensure data confidence. Snowflake’s continuous innovation in observability cements its position as the go-to cloud data platform for US enterprises seeking operational excellence and trust in their data pipelines.

Frequently asked questions (FAQs)
Q1: What is data observability in Snowflake?
Data observability in Snowflake means continuously monitoring and analyzing your data pipelines and tables using built-in features like Tasks, system metadata, and Snowpark to ensure data freshness, schema stability, and data quality without manual checks.
Q2: How can I schedule data quality checks in Snowflake?
Using Snowflake Tasks, you can schedule SQL queries or Snowpark procedures to run data validations periodically and log results for monitoring trends and alerting.
Q3: What role does AI play in Snowflake observability?
Snowflake Cortex integrates Large Language Models (LLMs) natively within Snowflake SQL, enabling adaptive, intelligent assessments of data health that simplify complex rule writing and improve anomaly detection accuracy as part of data and AI strategy.
Q4: Can Snowflake observability tools help with compliance?
Yes, by automatically tracking data quality metrics, schema changes, and anomalies with audit trails, Snowflake observability supports regulatory requirements for data accuracy and traceability, critical for US healthcare, finance, and retail sectors.
Q5: What third-party integrations work with Snowflake observability?
Snowflake’s observability telemetry and event tables support OpenTelemetry, allowing integration with US-favored monitoring tools like Grafana, PagerDuty, Slack, and Datadog for alerts and visualizations.