













Summary
Hospice length of stay forecasting estimates how long each patient will stay on service, so COOs can see cap exposure, staffing strain, and live discharge risk early. This guide covers what the models predict, the data they need, how accurate they are, and how to validate one before leadership relies on it.
Introduction
Ask most hospice leaders how long their current census will stay, and the honest answer is a number from last quarter’s report. That number describes stays that have already ended. Hospice length of stay forecasting estimates it patient by patient and day by day, so a COO can see cap exposure, staffing strain, and live discharge risk before any of them reach a compliance report.
The timing matters. FY 2027 began on October 1 with a higher aggregate cap, and CMS now displays provider-level service and spending scores built from claims data. Hospice care agencies that can’t forecast their own stays are guessing at both.
This guide is for COOs and clinical operations leaders at hospice and palliative care organizations. It covers what the models predict, the data they need, how accurate they really are, and how to validate one before your leadership team stakes a decision on it.
What hospice length-of-stay forecasting predicts
Hospice length of stay forecasting uses statistical and machine learning models to estimate how many days a patient will remain on hospice service. The estimate starts from clinical, functional, and claims data at admission and updates as the stay unfolds.
Most hospice data analytics programs produce one of three outputs:
- Survival probability by horizon. The chance a patient is still on service at 7, 30, 90, and 180 days.
- Stay-length bands. A short stay of under a week, a typical stay, or a long stay past 180 days.
- Live discharge risk. The likelihood a patient leaves hospice alive through revocation, an improved prognosis, or a move out of the service area.
How hospice length-of-stay prediction differs from hospital models
Most predictive analytics in healthcare was built for hospitals, where the question is when a patient goes home. A hospice model asks when a patient with a prognosis of six months or less will die or leave service, and the benefit’s rules shape that target. A hospice 6-month prognosis prediction model informs the physician’s certification, and the physician keeps the decision.
| Dimension | Hospital length of stay model | Hospice length of stay model |
| What it predicts | Days until discharge home or transfer | Days until death or live discharge |
| Typical horizon | Days to weeks | Days to six months and beyond |
| Why accuracy matters | Bed flow and discharge planning | Cap exposure, visit planning, and quality scores |
| Key inputs | Diagnosis, procedures, labs, vitals | Functional status, diagnosis trajectory, prior utilization, care setting |
| Regulatory tie | Throughput targets | Aggregate cap, Hospice Care Index, SSVI |
That’s why a hospital model can’t be reused as-is. The target, the error costs, and the regulatory stakes all change.
Palliative Care and Hospice Need Separate Models
The palliative care vs hospice line shapes your models. Palliative care sits outside the hospice benefit, so it carries no aggregate cap and no six-month certification. A 2026 study of 261,290 Australian palliative care patients found that predicting episode duration stayed modest, with R² around 0.2 after calibration. That’s a useful reality check for any palliative care length of stay AI project. Train each service line on its own data and set accuracy expectations before launch.
Why length of stay drives cap, quality, and staffing risk
Length of stay touches three pressure points at once: Medicare payment, quality scores, and clinical capacity. Each one rewards a hospice that sees stays coming.
How Hospices Use Predictive Models to Manage Aggregate Cap Risk
The aggregate cap limits total Medicare payments to a hospice in a cap year. CMS finalized the FY 2027 cap amount at $36,174.75 per beneficiary, up 2.3% from FY 2026. Long stays raise payments per beneficiary, which is the pressure the cap is designed to catch. A forecast lets finance and clinical leaders project hospice aggregate cap financial risk every month and act before the year closes.
Short Stays and Long Stays Both Carry Risk
Both ends of the distribution matter. In FY 2025, about 20% of Medicare fee-for-service hospice patients stayed four days or fewer, while the share staying past 180 days climbed from 14.5% in FY 2021 to 17.6%. Short stays strain admission and visit capacity. Long stays raise cap exposure and need a documented clinical case for continued eligibility.
| Lifetime length of stay | FY 2021 | FY 2025 | Change (points) |
| 1-4 days | 23.0% | 20.4% | -2.6 |
| 5-10 days | 18.1% | 16.4% | -1.7 |
| 11-30 days | 19.4% | 18.7% | -0.7 |
| 31-60 days | 10.6% | 10.9% | +0.3 |
| 61-90 days | 5.6% | 6.0% | +0.4 |
| 90-180 days | 8.9% | 10.0% | +1.1 |
| 181+ days | 14.5% | 17.6% | +3.1 |
Source: CMS Hospice Monitoring Report, April 2026. Share of Medicare fee-for-service beneficiaries whose hospice stays had ended. The change column is calculated from the CMS figures.
Why the Average Length of Stay in Hospice Misleads
Headline averages blur this split. About 56% of FY 2025 stays ended within 30 days, and more than one in six ran past 180. A single mean describes neither group well. Forecasting by band lets a hospice team plan for the stays it will actually see.
How Length of Stay Ties to the Hospice Care Index
Stay length also shows up in public quality scores. The Hospice Care Index scores hospices on ten claims-based indicators, including live discharges in the first seven days and live discharges on or after day 180. CMS reports that the live discharge rate among Medicare hospice patients rose from 16.9% in FY 2021 to 19.1% in FY 2025. Early and late departures are exactly the events a forecast helps a hospice team see coming.
Where the CMS Service and Spending Variation Index Fits
The SSVI adds a second lens. It scores each hospice on nine claims-based measures covering utilization and non-hospice spending, and CMS says higher scores signal potentially concerning patterns. A hospice that models its own claims sees its profile before CMS does.
What data does a hospice length-of-stay prediction model use?
Strong models draw on four families of data. Every input needs a timestamp, so the model sees only what the hospice team knew on the day of prediction.
- Functional status. Palliative Performance Scale (PPS) scores, decline in daily activities, weight loss, and oral intake. The PPS rates patients from 0% to 100% in 10-point steps across mobility, activity, self-care, intake, and level of consciousness.
- Diagnosis and trajectory. Primary diagnosis, comorbidities, and recent hospitalizations.
- Utilization and claims history. Prior hospital use, earlier hospice elections, referral source, and care setting.
- Operational signals. Visit frequency, level-of-care changes, and notes from the interdisciplinary group (IDG).
Using Palliative Performance Scale data in machine learning models
Functional scores earn their place because they change. One PPS score at admission is a snapshot. The slope across repeat assessments carries the signal, and pairing it with claims history gives the model both trajectory and context.
Why data integration decides model quality
These inputs sit in different systems. Functional scores live in the clinical record, utilization in billing, and referral context in intake tools. Teams that connect EHR, billing, and CMS reporting data first spend their modeling time on modeling.
Point-in-time discipline matters just as much. Every feature should carry the date the hospice team learned it, and any later edit should keep the original version. A model trained on cleaned-up history will look more accurate than it ever is in live use.
A governed gold layer serves these inputs as consistent, documented features, so a prediction made in March can be reproduced in an audit in June.
How accurate are machine learning models at predicting hospice length-of-stay?
Accuracy depends on the horizon. Machine learning hospice mortality prediction and palliative care prognosis prediction both separate near-term deaths well and drift on longer horizons.
In a 2026 prospective cohort of 166 advanced cancer patients in a palliative care unit, specialist judgment and two prognostic scores reached a concordance index above 0.8 for short-term survival. Clinical judgment tended to underestimate 7-day survival, and every tool tended to overestimate 90-day survival.
Duration is harder still, as the Australian study above shows. Use a forecast as a triage and planning signal with a stated error band, and keep the physician’s certification as the decision of record.
Machine Learning vs Clinical Judgment
Combine them. The same 2026 cohort study recommends pairing specialist judgment with a validated prognostic score. Build the workflow the same way: the model proposes a stay band, the hospice team reviews it, and each override is recorded and fed into the next retraining cycle. That’s how hospice eligibility prognostication tools earn clinical trust.
Predicting Non-Cancer Length of Stay for Dementia and Heart Failure
Cancer accounts for about 22% of hospice users in the latest CMS data, so most of a typical census follows a non-cancer path. Dementia, heart failure, and COPD decline more slowly and are harder to date. Validate every model by diagnosis group, care setting, and age band, and share the gaps with clinical leaders. A model that works for advanced cancer and misfires on dementia will quietly distort cap projections at hospice care agencies of any size.
How to build a hospice length-of-stay forecasting model leadership can defend
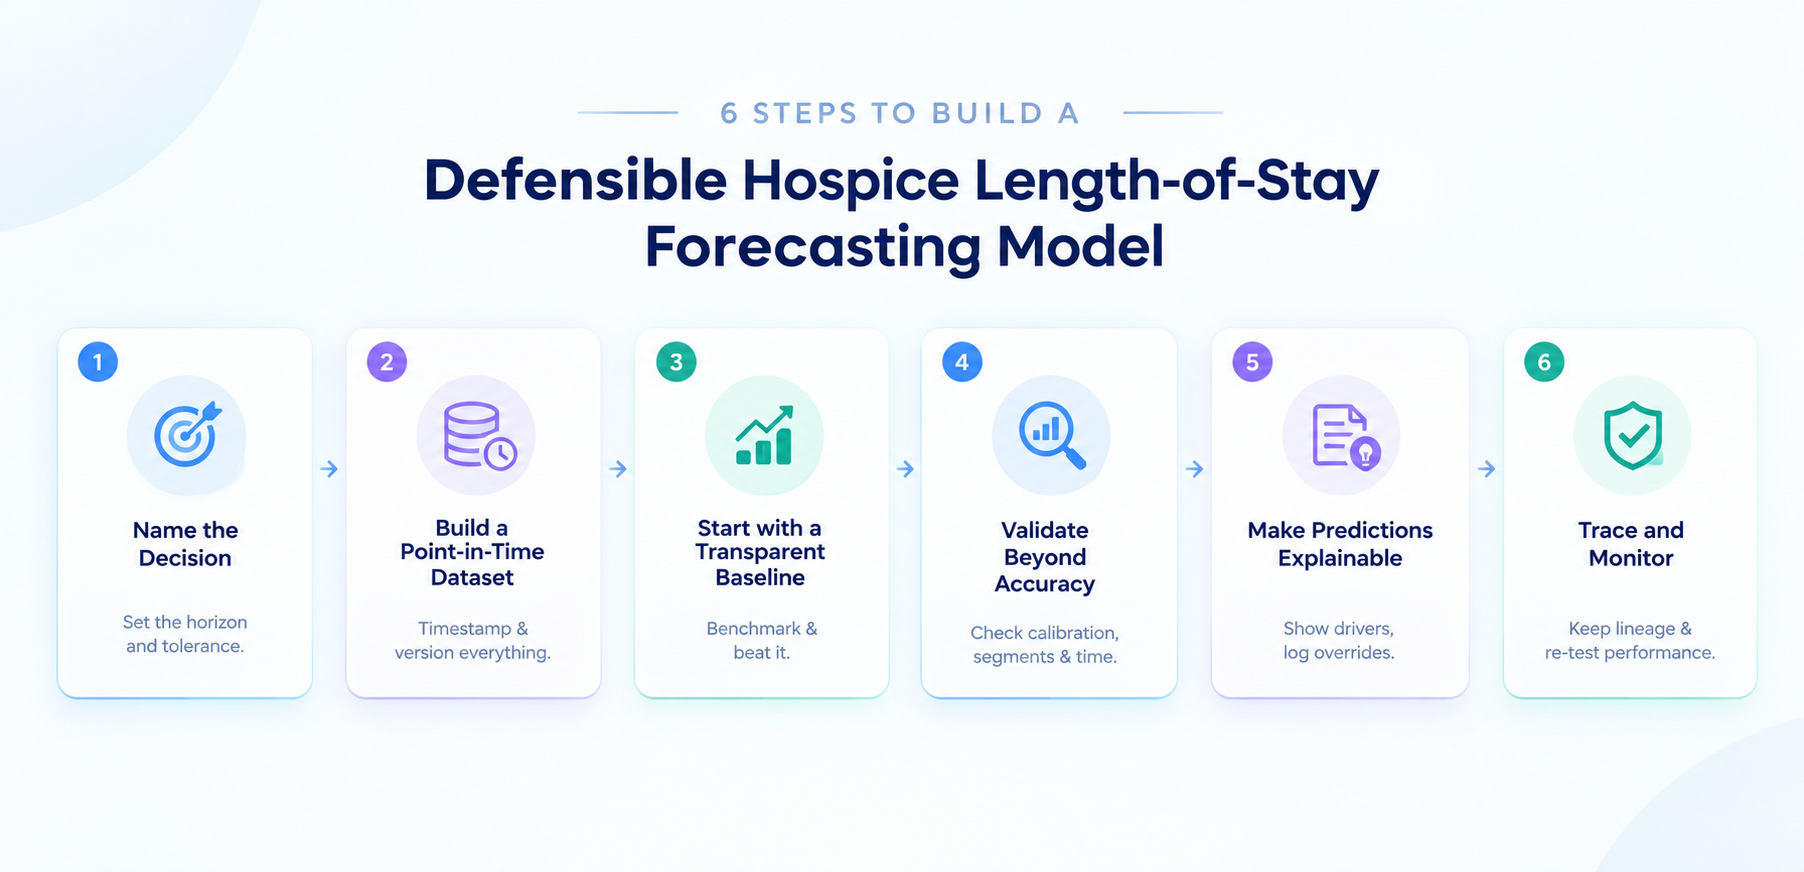
A defensible model is one a compliance officer, a medical director, and an outside reviewer can each interrogate. Six steps get you there.
- Name the decision. Cap projection, admission triage, visit planning, and live discharge outreach each need a different horizon and error tolerance.
- Build a point-in-time data set. Timestamp every feature and version every edit, so the model trains on what the hospice team knew at the time.
- Start with a transparent baseline. Logistic regression or a Cox model sets the benchmark. Gradient-boosted trees such as XGBoost have to beat it on calibration and subgroup performance as well as raw accuracy.
- Validate beyond accuracy. Check calibration by horizon, test on a later time period, and compare performance across diagnoses, care settings, and demographic groups.
- Make every prediction explainable. Show the top drivers for each patient, log clinician overrides, and keep model documentation current.
- Trace and monitor. Record where each input came from with audit-ready data lineage, and re-test performance after rule or workflow changes.
Clinical and compliance reviewers tend to ask the same three questions before they trust a model.
- Which inputs drove this estimate?
- How often has the model been wrong for patients like this one?
- Who can override it?
Build those answers into the interface, because they’re hard to add later.
Putting length of stay forecasts to work
A forecast earns its keep when it triggers a task. AI-powered automation for hospice works best when each forecast routes to a named owner with a due date.
Hospice Census Forecasting and Cap Planning
Roll patient-level forecasts into a monthly census and cap projection for finance and the COO. Then test scenarios, such as what happens if admission mix shifts toward longer-stay diagnoses.
Staffing and Visit Planning by Length of Stay
Patients with a high near-term mortality estimate need added nursing and social work visits in the coming days, which also supports the CMS Hospice Visits in the Last Days of Life measure. Long-stay patients need steady aide and nursing hours. A hospice team that schedules against both curves matches visit hours to need as it develops.
Live Discharge Rate Prediction and Recertification Risk
Compare each forecast with the patient’s recent functional trend. When they diverge, the patient is a candidate for an earlier IDG review, which lets a hospice catch an eligibility question before a recertification raises it. Our COO playbook on predicting readmission risk before it happens covers the same alert-to-action discipline for discharge loops.
Admission Timing and Referral Triage
Referrals with a high near-term mortality estimate can move to the front of the intake queue. A predictive model for hospice admission that also estimates timing tells the team how much capacity next week’s admissions will require.
Where the Return Shows Up First
Returns tend to appear where exposure is largest: avoided cap repayments, visit hours moved to higher-need days, and fewer avoidable early live discharges. A pilot on one service line, scored against your own history, shows the size of the prize before anyone commits budget.
Final Thoughts
Hospice length of stay forecasting won’t call any single patient’s final day, and good teams don’t ask it to. What it gives leadership is a calibrated view of the census, a stated margin of error, and a record of how each estimate was made. That’s the version that survives a question from the board or a reviewer.
It also depends on the data underneath it. Forecasting is one use of AI in hospice care, and the same governed foundation supports eligibility, documentation, and admissions work. This article is part of our series on predictive analytics for hospice operations, and the staffing, referral intake, and dashboard pieces of that series build on the same models.