












PDGM in 2027: How the 3% Temporary Adjustment and New Case-Mix Weights Change Your Margin

Yash Thakkar

Yash Thakkar

Blog Date

30 Oct 2026

Blog read Time

14 min

Share:

PDGM in 2027: How the 3% Temporary Adjustment and New Case-Mix Weights Change Your Margin

Quick Summary

TopicWhat to know
RuleCMS-1844-P (91 FR 41216). Comments closed Aug. 31, 2026. Final rule pending.
Net payment change+2.4% in aggregate, about $420 million.
30-day rate$2,038.22 in CY 2026 to $2,092.27 in CY 2027 (+2.65%).
Temporary adjustment3.0% reduction again, about $500 million.
Permanent adjustmentNone proposed for 2027.
Case mixWeights, functional levels, comorbidity subgroups and LUPA thresholds reset on CY 2025 data.
Act nowRebuild the 2027 revenue forecast by case-mix group.

Introduction

CMS proposes a 2.65% increase in the Medicare home health 30-day rate for 2027 and keeps a 3% temporary reduction in place. Agencies with thin margins may tighten admissions, which leaves hospital discharge teams and referring physicians with fewer places to send patients. Our covers the full rule.

The proposal appears in the Federal Register notice for CMS-1844-P, 91 FR 41216, published July 6, 2026. The headline 2.4% increase sounds generous. The real number for any one agency depends on the 3% temporary reduction, the recalibrated case-mix weights and the agency’s own cost growth.

The Patient-Driven Groupings Model (PDGM) marks a massive shift in how Medicare reimburses home health agencies. This shift moves away from therapy volume toward a value-driven, patient-centered system. This analysis, written for agency CFOs, controllers and revenue cycle leaders, walks through the rate math, the margin sensitivity, the case-mix and LUPA changes, and the data an agency needs to forecast 2027 revenue.

PDGM home health payments reward agencies that know their numbers by case-mix group, and home health PDGM margins punish those that don’t. Everything here is proposed, so final figures can differ once the rule posts.

What does the CY 2027 proposed rule do to home health payment rates?

CMS proposes a 2.4% net increase in aggregate Medicare home health payments for CY 2027, about $420 million, built from a 2.1% payment update and a 0.3% gain from the fixed-dollar loss ratio update.

The 2.1% update starts with a 3.1% market basket increase and subtracts a 1.0 percentage point productivity adjustment, according to the CMS fact sheet. Agencies that miss quality reporting requirements receive a 0.1% update, two points lower.

Per period, the math runs through a short chain of factors. The table below follows CMS’s own rate build.

StepFactor or amountWhat it does
CY 2026 base rate, before temporary adjustment$2,101.26Starting point for the 30-day period
Case-mix recalibration neutrality factorx 1.0045Holds total payments steady after the weights change
Wage index budget neutrality factorx 1.0009Offsets the wage index update
Payment update (HHAs that submit quality data)x 1.0212.1% update
CY 2027 rate, before temporary adjustment$2,156.98Rate if CMS applied no temporary reduction
Temporary adjustmentx 0.97003.0% reduction
CY 2027 rate, with temporary adjustment$2,092.27Compare with $2,038.22 in CY 2026 (+2.65%)
Rate for HHAs that miss quality reporting$2,051.29$40.98 less per period than the rate above

Notice that the 3.0% temporary reduction applies in both years. CMS removes the CY 2026 reduction and reapplies it for 2027, so it adds no new cut between the two rates, as the HFMA summary of the proposed rule shows. That’s why the per-period gain is 2.65%, a bit above the 2.1% update. The two neutrality factors contribute the extra half point.

The 2.4% aggregate figure and the 2.65% rate figure measure different things. One tracks estimated total spending, and the other tracks the standardized 30-day amount. Build your forecast from the rate, then reconcile to your own volume.

What is the 3% temporary adjustment in the 2027 home health rule?

The 3% temporary adjustment is a one-year reduction of the 30-day payment rate that CMS uses to recover overpayments it attributes to the way PDGM payments played out in earlier years.

Congress told CMS to compare the behavior it assumed when it launched the Patient-Driven Groupings Model in 2020 with the behavior it observes, then adjust rates to offset the gap. CMS has applied permanent cuts of 3.925% in CY 2023, 2.890% in CY 2024, 1.975% in CY 2025 and 1.023% in CY 2026.

The temporary piece recovers dollars. CMS totals $4,908,531,936 in temporary adjustment amounts for CY 2020 through CY 2025 and hasn’t yet counted CY 2026. The 3.0% reduction in 2027 would collect about $500 million, roughly a tenth of that balance, and CMS says it will estimate the CY 2026 amount in next year’s proposed rule.

CMS says collecting the full balance in one year would hurt agencies, so it spreads recovery over time. That structure matters to a CFO, because the account stays open. Until CMS closes it, the temporary reduction can return in future rules.

No new permanent adjustment appears in the proposal. CMS’s own math shows a further 4.062% reduction would account for 2020 to 2025 effects, yet it holds back. It points to case-mix recalibration, the OASIS-E change and earlier rate cuts as factors that began in 2023 and make PDGM-only attribution hard.

FeaturePermanent adjustmentTemporary adjustment
What it doesLowers the base rate going forward.Reduces payment for one year to recover past overpayments.
CY 2023 to CY 2026Cuts of 3.925%, 2.890%, 1.975% and 1.023%.3.0% reduction in CY 2026, plus recoupment for 2020 to 2024.
CY 2027 proposalNone.3.0% reduction (factor 0.9700), about $500 million.
Size of the accountCMS math: a further 4.062% would account for 2020 to 2025 effects.$4.91 billion cumulative through CY 2025. CY 2026 still to be determined.
Does it carry forward?Yes. It stays in the base rate.No. It applies only in the year CMS sets it.

Provider groups want the temporary reduction gone. LeadingAge’s comment letter says CMS should not finalize the 3.0% reduction for CY 2027 and argues the proposed cuts and outstanding adjustments should be eliminated.

The National Alliance for Care at Home goes further. Its primary recommendation is to eliminate all permanent and temporary adjustments, and at a minimum to drop the 3.0% reduction for 2027.

How much margin could the 2027 rate leave an agency?

On an agency with $1,800 in cost per 30-day period, the proposed 2027 rate gain covers cost growth of about 3.0% and no more.

The arithmetic is short. The rate rises from $2,038.22 to $2,092.27, a gain of $54.05 per period. The 3.0% temporary reduction costs $64.71 per period against the rate CMS would pay without it ($2,156.98 less $2,092.27). On 10,000 periods, that reduction takes $647,100 a year.

The table below tests three cost-growth scenarios against the $54.05 gain. It’s an illustration with our own arithmetic, built on a hypothetical cost base and the national standardized rate. Your case mix, wage index and LUPA mix will move the real numbers.

Cost growth per periodCost increase on $1,800Rate gainNet margin change per periodPer 10,000 periods
2.1% (matches the update)$37.80$54.05+$16.25+$162,500
3.1% (market basket CMS projects)$55.80$54.05-$1.75-$17,500
5.0% (labor-heavy cost pressure)$90.00$54.05-$35.95-$359,500

A gap of two points between cost growth and rate growth is enough to turn a steady margin into a shrinking one. Because home health is a labor-intensive service, wage pressure can outweigh any single policy line. A margin dashboard that tracks cost per period against the rate keeps that gap visible every month.

Forecasting risk adds to the squeeze. LeadingAge puts the cumulative gap between projected and actual market basket growth at 7.3 percentage points for CY 2021 through CY 2025, using CMS Office of the Actuary data, and the Alliance’s comment letter calculates 7.6 points.

Are PDGM payments still above agency costs, and who disagrees?

CMS says PDGM payments still run well above cost, with the CY 2025 30-day rate of $2,057.35 about 34% higher than its estimated cost of $1,532.84 per period.

MedPAC reaches a similar conclusion. Its March 2026 report cites a 21.2% margin for freestanding agencies in 2024 and says margins indicate that payments exceed costs. The chapter doesn’t include a CY 2027 update recommendation.

Providers see a different picture. LeadingAge cites CMS Office of the Actuary data showing that 36% of agencies had negative total all-payer margins in 2024. The Alliance argues that CMS and MedPAC margin calculations miss many true costs.

Those figures measure different things. Medicare margins look at one payer, while total margins cover all payers. Averages also hide spread, and a 21.2% average can sit beside an agency losing money on every Medicare episode.

SourcePosition on payment adequacyKey figure it cites
CMSPayments exceed cost, and the 3.0% temporary reduction recovers past overpayments.CY 2025 rate of $2,057.35 against estimated cost of $1,532.84 per period.
MedPACMargins indicate that payments exceed costs.21.2% margin for freestanding agencies in 2024.
LeadingAgeDo not finalize the 3.0% reduction, and correct the CY 2027 rate.36% of agencies had negative total all-payer margins in 2024; 7.3-point market basket forecast gap.
National Alliance for Care at HomeEliminate all adjustments, or at least drop the 3.0% reduction for 2027.7.6-point market basket forecast gap; estimates $18.9 billion in cumulative permanent reductions, 2020 to 2030.

Quick Summary
Topic	What to know
Rule	CMS-1844-P (91 FR 41216). Comments closed Aug. 31, 2026. Final rule pending.
Net payment change	+2.4% in aggregate, about $420 million.
30-day rate	$2,038.22 in CY 2026 to $2,092.27 in CY 2027 (+2.65%).
Temporary adjustment	3.0% reduction again, about $500 million.
Permanent adjustment	None proposed for 2027.
Case mix	Weights, functional levels, comorbidity subgroups and LUPA thresholds reset on CY 2025 data.
Act now	Rebuild the 2027 revenue forecast by case-mix group.  CMS proposes a 2.65% increase in the Medicare home health 30-day rate for 2027 and keeps a 3% temporary reduction in place. Agencies with thin margins may tighten admissions, which leaves hospital discharge teams and referring physicians with fewer places to send patients. Our CY 2027 home health rule overview covers the full rule.
The proposal appears in the Federal Register notice for CMS-1844-P, 91 FR 41216, published July 6, 2026. The headline 2.4% increase sounds generous. The real number for any one agency depends on the 3% temporary reduction, the recalibrated case-mix weights and the agency's own cost growth.
The Patient-Driven Groupings Model (PDGM) marks a massive shift in how Medicare reimburses home health agencies. This shift moves away from therapy volume toward a value-driven, patient-centered system. This analysis, written for agency CFOs, controllers and revenue cycle leaders, walks through the rate math, the margin sensitivity, the case-mix and LUPA changes, and the data an agency needs to forecast 2027 revenue. 
PDGM home health payments reward agencies that know their numbers by case-mix group, and home health PDGM margins punish those that don't. Everything here is proposed, so final figures can differ once the rule posts.
What does the CY 2027 proposed rule do to home health payment rates?
CMS proposes a 2.4% net increase in aggregate Medicare home health payments for CY 2027, about $420 million, built from a 2.1% payment update and a 0.3% gain from the fixed-dollar loss ratio update.
The 2.1% update starts with a 3.1% market basket increase and subtracts a 1.0 percentage point productivity adjustment, according to the CMS fact sheet. Agencies that miss quality reporting requirements receive a 0.1% update, two points lower.
Per period, the math runs through a short chain of factors. The table below follows CMS's own rate build.
Step	Factor or amount	What it does
CY 2026 base rate, before temporary adjustment	$2,101.26	Starting point for the 30-day period
Case-mix recalibration neutrality factor	x 1.0045	Holds total payments steady after the weights change
Wage index budget neutrality factor	x 1.0009	Offsets the wage index update
Payment update (HHAs that submit quality data)	x 1.021	2.1% update
CY 2027 rate, before temporary adjustment	$2,156.98	Rate if CMS applied no temporary reduction
Temporary adjustment	x 0.9700	3.0% reduction
CY 2027 rate, with temporary adjustment	$2,092.27	Compare with $2,038.22 in CY 2026 (+2.65%)
Rate for HHAs that miss quality reporting	$2,051.29	$40.98 less per period than the rate above  Notice that the 3.0% temporary reduction applies in both years. CMS removes the CY 2026 reduction and reapplies it for 2027, so it adds no new cut between the two rates, as the HFMA summary of the proposed rule shows. That's why the per-period gain is 2.65%, a bit above the 2.1% update. The two neutrality factors contribute the extra half point.
The 2.4% aggregate figure and the 2.65% rate figure measure different things. One tracks estimated total spending, and the other tracks the standardized 30-day amount. Build your forecast from the rate, then reconcile to your own volume.
What is the 3% temporary adjustment in the 2027 home health rule?
The 3% temporary adjustment is a one-year reduction of the 30-day payment rate that CMS uses to recover overpayments it attributes to the way PDGM payments played out in earlier years.
Congress told CMS to compare the behavior it assumed when it launched the Patient-Driven Groupings Model in 2020 with the behavior it observes, then adjust rates to offset the gap. CMS has applied permanent cuts of 3.925% in CY 2023, 2.890% in CY 2024, 1.975% in CY 2025 and 1.023% in CY 2026.
The temporary piece recovers dollars. CMS totals $4,908,531,936 in temporary adjustment amounts for CY 2020 through CY 2025 and hasn't yet counted CY 2026. The 3.0% reduction in 2027 would collect about $500 million, roughly a tenth of that balance, and CMS says it will estimate the CY 2026 amount in next year's proposed rule.
CMS says collecting the full balance in one year would hurt agencies, so it spreads recovery over time. That structure matters to a CFO, because the account stays open. Until CMS closes it, the temporary reduction can return in future rules.
No new permanent adjustment appears in the proposal. CMS's own math shows a further 4.062% reduction would account for 2020 to 2025 effects, yet it holds back. It points to case-mix recalibration, the OASIS-E change and earlier rate cuts as factors that began in 2023 and make PDGM-only attribution hard.
Feature	Permanent adjustment	Temporary adjustment
What it does	Lowers the base rate going forward.	Reduces payment for one year to recover past overpayments.
CY 2023 to CY 2026	Cuts of 3.925%, 2.890%, 1.975% and 1.023%.	3.0% reduction in CY 2026, plus recoupment for 2020 to 2024.
CY 2027 proposal	None.	3.0% reduction (factor 0.9700), about $500 million.
Size of the account	CMS math: a further 4.062% would account for 2020 to 2025 effects.	$4.91 billion cumulative through CY 2025. CY 2026 still to be determined.
Does it carry forward?	Yes. It stays in the base rate.	No. It applies only in the year CMS sets it.  Provider groups want the temporary reduction gone. LeadingAge's comment letter says CMS should not finalize the 3.0% reduction for CY 2027 and argues the proposed cuts and outstanding adjustments should be eliminated.
The National Alliance for Care at Home goes further. Its primary recommendation is to eliminate all permanent and temporary adjustments, and at a minimum to drop the 3.0% reduction for 2027.
How much margin could the 2027 rate leave an agency?
On an agency with $1,800 in cost per 30-day period, the proposed 2027 rate gain covers cost growth of about 3.0% and no more.
The arithmetic is short. The rate rises from $2,038.22 to $2,092.27, a gain of $54.05 per period. The 3.0% temporary reduction costs $64.71 per period against the rate CMS would pay without it ($2,156.98 less $2,092.27). On 10,000 periods, that reduction takes $647,100 a year.
The table below tests three cost-growth scenarios against the $54.05 gain. It's an illustration with our own arithmetic, built on a hypothetical cost base and the national standardized rate. Your case mix, wage index and LUPA mix will move the real numbers.
Cost growth per period	Cost increase on $1,800	Rate gain	Net margin change per period	Per 10,000 periods
2.1% (matches the update)	$37.80	$54.05	+$16.25	+$162,500
3.1% (market basket CMS projects)	$55.80	$54.05	-$1.75	-$17,500
5.0% (labor-heavy cost pressure)	$90.00	$54.05	-$35.95	-$359,500  A gap of two points between cost growth and rate growth is enough to turn a steady margin into a shrinking one. Because home health is a labor-intensive service, wage pressure can outweigh any single policy line. A margin dashboard that tracks cost per period against the rate keeps that gap visible every month.
Forecasting risk adds to the squeeze. LeadingAge puts the cumulative gap between projected and actual market basket growth at 7.3 percentage points for CY 2021 through CY 2025, using CMS Office of the Actuary data, and the Alliance's comment letter calculates 7.6 points.
Are PDGM payments still above agency costs, and who disagrees?
CMS says PDGM payments still run well above cost, with the CY 2025 30-day rate of $2,057.35 about 34% higher than its estimated cost of $1,532.84 per period.
MedPAC reaches a similar conclusion. Its March 2026 report cites a 21.2% margin for freestanding agencies in 2024 and says margins indicate that payments exceed costs. The chapter doesn't include a CY 2027 update recommendation.
Providers see a different picture. LeadingAge cites CMS Office of the Actuary data showing that 36% of agencies had negative total all-payer margins in 2024. The Alliance argues that CMS and MedPAC margin calculations miss many true costs.
Those figures measure different things. Medicare margins look at one payer, while total margins cover all payers. Averages also hide spread, and a 21.2% average can sit beside an agency losing money on every Medicare episode.
Source	Position on payment adequacy	Key figure it cites
CMS	Payments exceed cost, and the 3.0% temporary reduction recovers past overpayments.	CY 2025 rate of $2,057.35 against estimated cost of $1,532.84 per period.
MedPAC	Margins indicate that payments exceed costs.	21.2% margin for freestanding agencies in 2024.
LeadingAge	Do not finalize the 3.0% reduction, and correct the CY 2027 rate.	36% of agencies had negative total all-payer margins in 2024; 7.3-point market basket forecast gap.
National Alliance for Care at Home	Eliminate all adjustments, or at least drop the 3.0% reduction for 2027.	7.6-point market basket forecast gap; estimates $18.9 billion in cumulative permanent reductions, 2020 to 2030.

How do the 2027 case-mix weights and comorbidity subgroups change?

CMS recalibrates all 432 PDGM payment groups with CY 2025 claims and updates the comorbidity adjustment to 21 low-comorbidity subgroups and 100 high-comorbidity interaction subgroups.

Each 30-day period lands in one of the 432 groups, set by admission source, timing, clinical group, functional impairment level and comorbidity adjustment. CMS applies a case-mix neutrality factor of 1.0045, which tells you the new weights, taken alone, pay slightly less on average and that CMS lifts the rate to hold spending steady.

Group-level weights appear in Table 24 of the Federal Register notice. The net effect varies by clinical group, so every agency should rerun its own mix and skip the national average.

Comorbidity coding deserves a CFO’s attention. The share of periods with no comorbidity adjustment fell from 49.1% in 2020 to 24.1% in 2025, while low and high adjustments grew.

Comorbidity adjustmentShare of periods, 2020Share of periods, 2025Change
None49.1%24.1%-25.0 points
Low36.9%58.3%+21.4 points
High14.0%17.6%+3.6 points

Coding of comorbidities is one of the behaviors CMS assumed when it set PDGM rates in 2019, so this drift sits at the center of the adjustment debate. MedPAC adds that these measures can be sensitive to coding practices, so supporting documentation protects both revenue and audit position. Our briefing on covers the records agencies should keep audit-ready.

How do functional levels, OASIS and LUPA thresholds move revenue?

Functional impairment levels come from OASIS items, and CMS updates the point values and level cutoffs with CY 2025 data (Tables 19 and 20 of the proposed rule).

Each functional level maps to a payment weight, so a scoring error at admission or recertification changes revenue for the whole 30-day period. Agencies that treat home health OASIS accuracy and home health documentation as billing controls catch those errors before claims drop, and our guide to home health quality reporting in 2027 covers the OASIS deadlines that sit alongside them.

LUPA thresholds follow a simple rule. CMS sets each at the 10th percentile of visits for the group, with a floor of two visits. In 2027, 18 groups see the threshold drop by one visit and two groups see it rise by one.

The detail by group is in our article on LUPA in 2027. For finance, the point is exposure: a period that falls below its threshold pays per visit, and the per-visit rates sit far below the full period amount.

Utilization has moved a long way since PDGM began. The table below pulls the headline trends from the HFMA summary.

MeasureEarlier point2025Change
30-day periods9.34 million (2018, simulated)7.72 millionDown 1.62 million
Visits per 30-day period9.86 (2018, simulated)7.77Down 21.2%
LUPA share of periods8.7% (2020 peak)6.6%Down 2.1 points

How can an agency forecast 2027 PDGM reimbursement?

A reliable 2027 forecast starts with the case-mix group of every active episode, then applies the proposed rate, the neutrality factors and the 3.0% temporary reduction in that order.

Most forecast errors trace back to inputs scattered across home health software, billing files and spreadsheets. Admission source sits in the intake record, functional scores in OASIS, visit counts in scheduling and claim status in billing. When home health agency software keeps each piece in a separate module, finance rebuilds the picture by hand every month.

The choice of platform matters here. Our roundup of the best home health EMR options explains how the major systems handle assessment and billing data.

Forecast inputWhere it usually livesWhat to check for 2027
Admission source and timingEMR and intake recordsMaps cleanly to the 432-group structure.
Functional level and comorbidityOASIS and diagnosis codingRe-score with the 2027 points and subgroups once final.
Rate componentsCMS rate tablesBase rate, neutrality factors, 0.9700 temporary factor, quality-reporting status.
Visit patterns and LUPA exposureScheduling and visit logsProjected visits against the 2027 thresholds.
Claims and cash timingBilling and revenue cycle systemsDays to bill, open episodes, denials.
Payer mix and authorizationsPayer portals and MA contractsApproved versus pending prior authorizations.

Home health revenue cycle management teams already track days to bill, open episodes and denials. The forecast adds the 2027 rate, the new weights and the temporary factor on top of that discipline.

Inferenz connects an agency’s data into one system, so the forecast reads from one version of the facts. Revenue and reimbursement forecasting then runs on connected data and refreshes as the records change.

Run three scenarios: the rule as proposed, a final rule that drops the temporary reduction and one that keeps it. At the standardized rate, the gap between the first two is $64.71 per period, or $647,100 for every 10,000 periods.

How do staffing and scheduling decisions show up in PDGM margin?

Staffing and scheduling set cost per period and visit counts, the two numbers that decide whether a PDGM rate covers the work.

Visits per period averaged 7.77 in 2025, down from 9.86 in the simulated 2018 baseline. Every extra visit adds cost without adding payment, and every missed visit pushes a period toward its LUPA threshold. Home health staffing gaps show up as overtime, contract labor or declined referrals.

The Alliance’s comment letter says 38% of Medicare beneficiaries referred for home health at hospital discharge did not receive it through the third quarter of 2025. Patients and referring physicians feel capacity limits first.

Home health scheduling software that shows a patient’s LUPA threshold next to clinician availability helps coordinators protect both access and margin. Our piece on home health staffing analytics and capacity planning shows how care networks put that data to work.

How can AI agents help protect PDGM margins?

How can AI agents help protect PDGM margins

Home health AI protects PDGM margins when it works on connected data and takes over repeatable workflows, such as authorization tracking and revenue forecasting.

Inferenz connects an agency’s data into one system, and the Caregence platform helps stakeholders build custom agents for their own workflows. The platform integrates with MCP tools and existing systems, so an agent reads from the records an agency already keeps.

Medicare Advantage prior authorization is a clear example. An episode that starts without an approval can leave visits unpaid, so approval status belongs in the revenue forecast.

Stakeholders can build an Authorization Agent for MA prior authorization on the platform to track requests, flag pending approvals before the start of care and feed that status into the forecast.

Keep the boundaries clear. No tool changes the CMS rate, and agents don’t replace clinical coding or payer policy decisions. They give finance and operations leaders an earlier, cleaner view of their own numbers.

For payers that expose electronic prior authorization interfaces, our analysis of FHIR prior authorization APIs weighs the build, buy and integrate options.

What should finance leaders do before the final rule posts?

Finance leaders should rebuild the 2027 revenue model by case-mix group now and update it the day the final rule posts.

The final rule has been under review at OMB since September 21, and it hadn’t posted as of October 29, 2026. Our will carry the proposed-versus-final comparison once it does.

  1. Load the 2027 rate build and the Table 24 weights into your revenue model.
  2. Re-run every active episode through the 432-group structure.
  3. Model the 3.0% temporary reduction as its own line so you can switch it off if the final rule drops it.
  4. Test cost growth at 2.1%, 3.1% and 5.0% against your own per-period rate gain.
  5. Check LUPA exposure against the 18 lower and 2 higher thresholds.
  6. Audit OASIS scoring and documentation on high-functional-level and high-comorbidity episodes.
  7. Confirm prior authorization status for every Medicare Advantage admission.
  8. Write a same-day plan to update the model when the final rule posts.

The final rule could change any figure in this article. Home health agencies with assessment, scheduling and billing data in one place can compare each final number against the proposed values here the day it posts.

Final thoughts

The 2027 proposal is a modest raise with a familiar catch. A 2.65% rate gain stretches only as far as an agency’s cost growth, and in our example it covers about 3% on an $1,800 cost base. Agencies with strong documentation, tight scheduling and clean data hold their margin. Agencies without them feel every point of cost inflation.

Start with the model. Load the new rate build, run your episodes through the 432 groups and see where the gap opens. Then close it one workflow at a time.

How do the 2027 case-mix weights and comorbidity subgroups change?
CMS recalibrates all 432 PDGM payment groups with CY 2025 claims and updates the comorbidity adjustment to 21 low-comorbidity subgroups and 100 high-comorbidity interaction subgroups.
Each 30-day period lands in one of the 432 groups, set by admission source, timing, clinical group, functional impairment level and comorbidity adjustment. CMS applies a case-mix neutrality factor of 1.0045, which tells you the new weights, taken alone, pay slightly less on average and that CMS lifts the rate to hold spending steady.
Group-level weights appear in Table 24 of the Federal Register notice. The net effect varies by clinical group, so every agency should rerun its own mix and skip the national average.
Comorbidity coding deserves a CFO's attention. The share of periods with no comorbidity adjustment fell from 49.1% in 2020 to 24.1% in 2025, while low and high adjustments grew.
Comorbidity adjustment	Share of periods, 2020	Share of periods, 2025	Change
None	49.1%	24.1%	-25.0 points
Low	36.9%	58.3%	+21.4 points
High	14.0%	17.6%	+3.6 points  Coding of comorbidities is one of the behaviors CMS assumed when it set PDGM rates in 2019, so this drift sits at the center of the adjustment debate. MedPAC adds that these measures can be sensitive to coding practices, so supporting documentation protects both revenue and audit position. Our briefing on Medicare enrollment and program integrity in the 2027 rule covers the records agencies should keep audit-ready.
How do functional levels, OASIS and LUPA thresholds move revenue?
Functional impairment levels come from OASIS items, and CMS updates the point values and level cutoffs with CY 2025 data (Tables 19 and 20 of the proposed rule).
Each functional level maps to a payment weight, so a scoring error at admission or recertification changes revenue for the whole 30-day period. Agencies that treat home health OASIS accuracy and home health documentation as billing controls catch those errors before claims drop, and our guide to home health quality reporting in 2027 covers the OASIS deadlines that sit alongside them.
LUPA thresholds follow a simple rule. CMS sets each at the 10th percentile of visits for the group, with a floor of two visits. In 2027, 18 groups see the threshold drop by one visit and two groups see it rise by one.
The detail by group is in our article on LUPA in 2027. For finance, the point is exposure: a period that falls below its threshold pays per visit, and the per-visit rates sit far below the full period amount.
Utilization has moved a long way since PDGM began. The table below pulls the headline trends from the HFMA summary.
Measure	Earlier point	2025	Change
30-day periods	9.34 million (2018, simulated)	7.72 million	Down 1.62 million
Visits per 30-day period	9.86 (2018, simulated)	7.77	Down 21.2%
LUPA share of periods	8.7% (2020 peak)	6.6%	Down 2.1 points  How can an agency forecast 2027 PDGM reimbursement?
A reliable 2027 forecast starts with the case-mix group of every active episode, then applies the proposed rate, the neutrality factors and the 3.0% temporary reduction in that order.
Most forecast errors trace back to inputs scattered across home health software, billing files and spreadsheets. Admission source sits in the intake record, functional scores in OASIS, visit counts in scheduling and claim status in billing. When home health agency software keeps each piece in a separate module, finance rebuilds the picture by hand every month.
The choice of platform matters here. Our roundup of the best home health EMR options explains how the major systems handle assessment and billing data.
Forecast input	Where it usually lives	What to check for 2027
Admission source and timing	EMR and intake records	Maps cleanly to the 432-group structure.
Functional level and comorbidity	OASIS and diagnosis coding	Re-score with the 2027 points and subgroups once final.
Rate components	CMS rate tables	Base rate, neutrality factors, 0.9700 temporary factor, quality-reporting status.
Visit patterns and LUPA exposure	Scheduling and visit logs	Projected visits against the 2027 thresholds.
Claims and cash timing	Billing and revenue cycle systems	Days to bill, open episodes, denials.
Payer mix and authorizations	Payer portals and MA contracts	Approved versus pending prior authorizations.  Home health revenue cycle management teams already track days to bill, open episodes and denials. The forecast adds the 2027 rate, the new weights and the temporary factor on top of that discipline.
Inferenz connects an agency's data into one system, so the forecast reads from one version of the facts. Revenue and reimbursement forecasting then runs on connected data and refreshes as the records change.
Run three scenarios: the rule as proposed, a final rule that drops the temporary reduction and one that keeps it. At the standardized rate, the gap between the first two is $64.71 per period, or $647,100 for every 10,000 periods.
How do staffing and scheduling decisions show up in PDGM margin?
Staffing and scheduling set cost per period and visit counts, the two numbers that decide whether a PDGM rate covers the work.
Visits per period averaged 7.77 in 2025, down from 9.86 in the simulated 2018 baseline. Every extra visit adds cost without adding payment, and every missed visit pushes a period toward its LUPA threshold. Home health staffing gaps show up as overtime, contract labor or declined referrals.
The Alliance's comment letter says 38% of Medicare beneficiaries referred for home health at hospital discharge did not receive it through the third quarter of 2025. Patients and referring physicians feel capacity limits first.
Home health scheduling software that shows a patient's LUPA threshold next to clinician availability helps coordinators protect both access and margin. Our piece on home health staffing analytics and capacity planning shows how care networks put that data to work.
How can AI agents help protect PDGM margins?
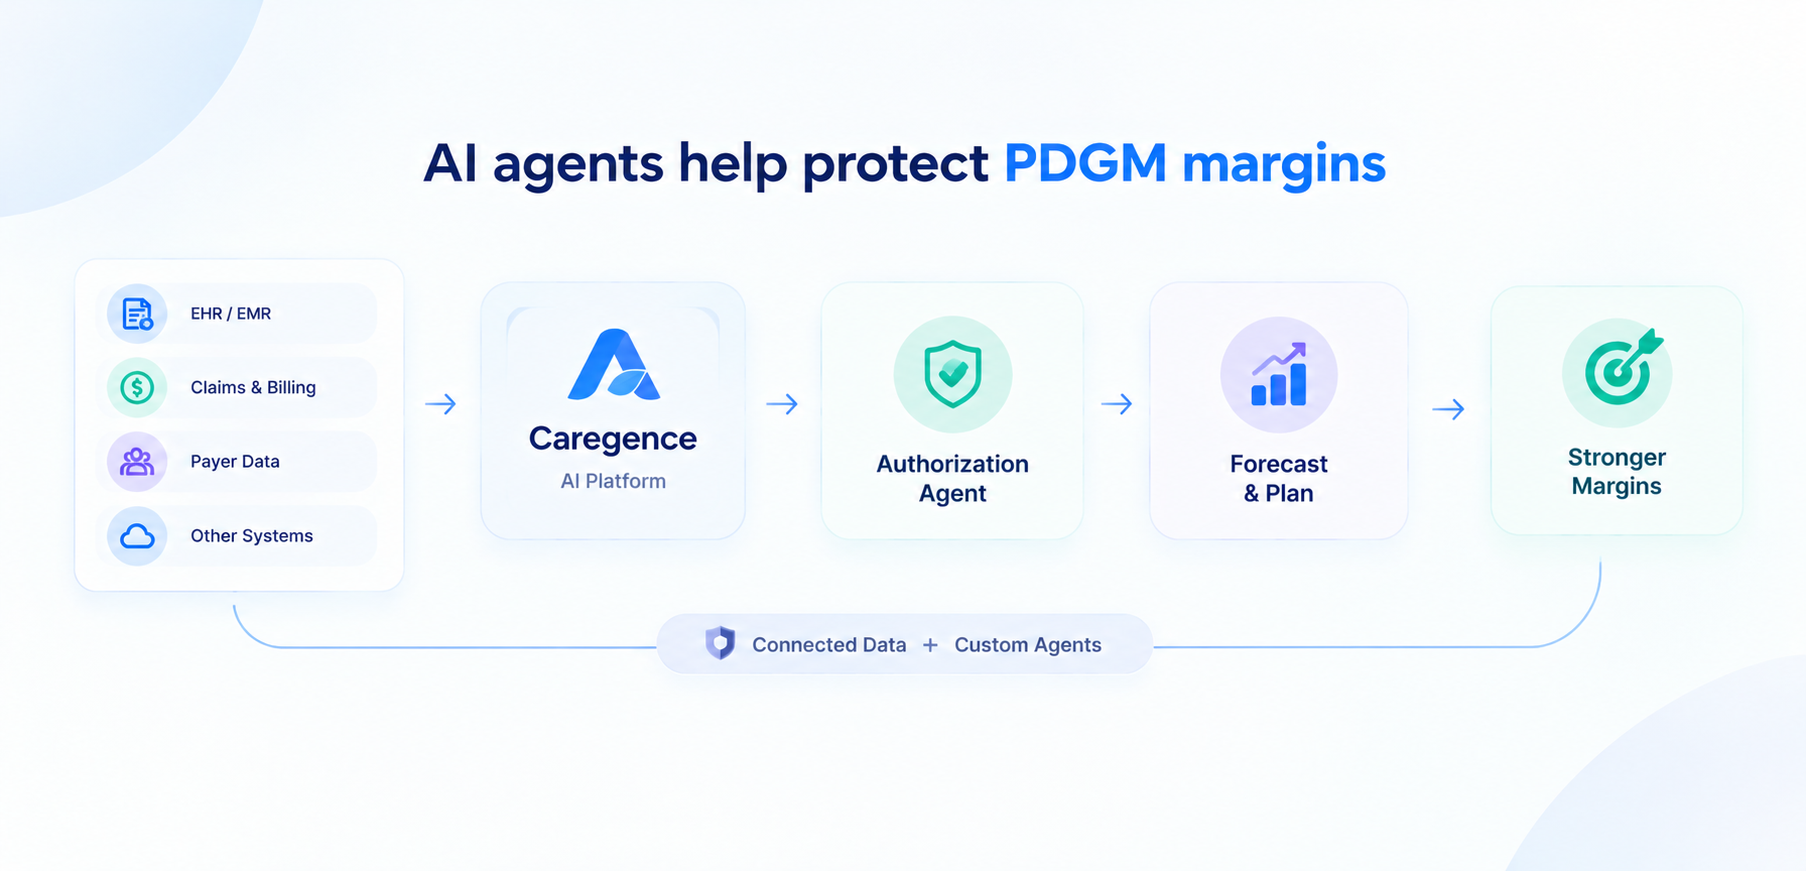
Home health AI protects PDGM margins when it works on connected data and takes over repeatable workflows, such as authorization tracking and revenue forecasting.
Inferenz connects an agency's data into one system, and the Caregence platform helps stakeholders build custom agents for their own workflows. The platform integrates with MCP tools and existing systems, so an agent reads from the records an agency already keeps.
Medicare Advantage prior authorization is a clear example. An episode that starts without an approval can leave visits unpaid, so approval status belongs in the revenue forecast.
Stakeholders can build an Authorization Agent for MA prior authorization on the platform to track requests, flag pending approvals before the start of care and feed that status into the forecast.
Keep the boundaries clear. No tool changes the CMS rate, and agents don't replace clinical coding or payer policy decisions. They give finance and operations leaders an earlier, cleaner view of their own numbers.
For payers that expose electronic prior authorization interfaces, our analysis of FHIR prior authorization APIs weighs the build, buy and integrate options.
What should finance leaders do before the final rule posts?
Finance leaders should rebuild the 2027 revenue model by case-mix group now and update it the day the final rule posts.
The final rule has been under review at OMB since September 21, and it hadn't posted as of October 29, 2026. Our CY 2027 home health rule overview will carry the proposed-versus-final comparison once it does.
1.	Load the 2027 rate build and the Table 24 weights into your revenue model.
2.	Re-run every active episode through the 432-group structure.
3.	Model the 3.0% temporary reduction as its own line so you can switch it off if the final rule drops it.
4.	Test cost growth at 2.1%, 3.1% and 5.0% against your own per-period rate gain.
5.	Check LUPA exposure against the 18 lower and 2 higher thresholds.
6.	Audit OASIS scoring and documentation on high-functional-level and high-comorbidity episodes.
7.	Confirm prior authorization status for every Medicare Advantage admission.
8.	Write a same-day plan to update the model when the final rule posts.  The final rule could change any figure in this article. Home health agencies with assessment, scheduling and billing data in one place can compare each final number against the proposed values here the day it posts.
Final thoughts
The 2027 proposal is a modest raise with a familiar catch. A 2.65% rate gain stretches only as far as an agency's cost growth, and in our example it covers about 3% on an $1,800 cost base. Agencies with strong documentation, tight scheduling and clean data hold their margin. Agencies without them feel every point of cost inflation.
Start with the model. Load the new rate build, run your episodes through the 432 groups and see where the gap opens. Then close it one workflow at a time.
Frequently Asked Questions

CMS proposes a 2.4% net payment increase, about $420 million, built from a 2.1% update and a 0.3% gain from the fixed-dollar loss ratio. It also recalibrates PDGM case-mix weights, functional levels, comorbidity subgroups and LUPA thresholds on CY 2025 data, keeps a 3.0% temporary adjustment and proposes no new permanent adjustment.

Up, as proposed. The 30-day rate would rise from $2,038.22 in CY 2026 to $2,092.27 in CY 2027, a 2.65% increase for agencies that submit quality data. The 3.0% temporary reduction applies in both years, so it adds no new cut between them.

It is a one-year, 3.0% reduction of the 30-day rate that lets CMS recover overpayments it attributes to differences between assumed and actual PDGM behavior. CMS estimates it would collect about $500 million in 2027, against $4.91 billion in cumulative temporary adjustment amounts for CY 2020 through CY 2025.

No. CMS proposes none. Its own calculation shows a further permanent reduction of 4.062% would account for 2020 to 2025 effects, but CMS says it’s hard to attribute 2023 through 2025 behavior to PDGM alone because other policy changes happened in those years.

Eighteen case-mix groups would see their LUPA threshold fall by one visit, and two groups would see it rise by one visit. CMS sets each threshold at the 10th percentile of visits for the group, with a floor of two visits.

They receive a 0.1% payment update, while agencies that report get 2.1%. On the CY 2027 rate build, that works out to $2,051.29 per 30-day period against $2,092.27, a gap of $40.98.

AI helps when it works on connected data and handles repeatable workflows, such as tracking Medicare Advantage authorizations and forecasting revenue by case-mix group. Stakeholders can build custom agents for those workflows on the Caregence platform, which integrates with MCP tools and existing systems. Clinical coding and payer policy stay with the agency.

About the author

Yash Thakkar

Yash Thakkar

Author

LinkedIn

Yash Thakkar is the Co-Founder and Managing Director of Inferenz, where he drives the company’s strategic vision and growth in Data and AI innovation. With 20+ years of experience in Data and AI, he focuses on building transformative technology solutions, fostering innovation, and helping enterprises accelerate digital transformation through data-driven strategies and intelligent automation.