














Summary
Home health staffing analytics shows home-based care networks where visit capacity leaks: turnover, scheduling friction, drive time, and documentation load. This guide covers capacity planning, workforce forecasting, burnout signals, and referral conversion, so COOs can match staffing to demand across home health, home care, and hospice.
Introduction
A hospital can count its empty beds. A home health agency has no equivalent, and neither does Medicare. MedPAC’s March 2026 report says no occupancy-style measure exists for home health care, so claims data can’t show whether an agency has room for one more patient.
Operators feel that gap every week. Homecare Homebase data reported by Home Health Care News shows referral conversion down 13%, with staffing-related rejections running about twice their pre-pandemic level.
Home health staffing analytics closes the gap. It joins scheduling, EVV, payroll, referral, and case-mix data into one view of how many visits your network can deliver next week and next quarter. It extends the staffing layer of predictive analytics for hospice operations to every line of a home-based care network.
This guide covers capacity, metrics, forecasting, burnout signals, payment scenarios, and shared hospice and home health nursing. Each section opens with a direct answer.
What is capacity planning in home health?
Capacity planning in home health estimates how many visits a network can deliver, compares that with expected referral demand, and closes the gap through scheduling, hiring, and training. It links three numbers: demand (referrals and census), supply (clinician and caregiver hours), and the share of those hours that reach a patient.
Why is time the real constraint in home health staffing?
Hiring can’t outrun churn. The Bureau of Labor Statistics counts 4.7 million home health and personal care aides in 2025 and projects about 760,500 openings a year through 2035. Most of those openings replace workers who leave the occupation or the labor force.
Capacity also leaks after the hire. Home Health Care News reported in July 2026 that documentation burden and scheduling friction drive home-based care turnover. Long drives and charting that spills into evenings take hours that a headcount number still counts as available.
Visit capacity = retained headcount × productive hours per head × share placed where demand sits. Recruiting feeds the first term. Analytics works on all three.
What does the 2026 data say about home health staffing and referral conversion?
It shows rising demand, heavy churn, and falling conversion. The table collects the latest federal and trade figures in one place.
| Indicator | Latest figure | Source |
| Home health and personal care aides employed, 2025 | 4,677,100 | BLS, updated August 2026 |
| Projected annual openings, 2025 to 2035 | About 760,500 | BLS |
| Home health RN turnover | 25.46% | Homecare Homebase via Home Health Care News, July 2026 |
| Home health aide turnover | 34% | Homecare Homebase via Home Health Care News, July 2026 |
| Personal care caregiver turnover | Above 70% in many markets | Homecare Homebase via Home Health Care News, July 2026 |
| Referral conversion | Down 13% | Homecare Homebase via Home Health Care News, July 2026 |
| In-person visits per full 30-day period, FFS Medicare, 2024 | 8.4, down from 10.2 in 2019 | MedPAC, March 2026 |
| Hospital discharges followed by a home health period, early 2024 | 18.0%, up from 15.8% in 2019 | MedPAC, March 2026 |
Sources: BLS Occupational Outlook Handbook; Home Health Care News (July 2026); MedPAC March 2026 Report to the Congress, Chapter 8.
Agencies deliver fewer visits per period than in 2019, while hospitals lean on home health more. The cause is mixed because payment design changed in 2020, so track visits per period by branch as your baseline.
How do referral conversion rates connect to staffing capacity?
A declined referral is a capacity signal. When an agency can’t staff a start of care inside the referral source’s window, the referral goes elsewhere and conversion falls. MedPAC adds that studies link delayed starts of home health care to adverse outcomes, so speed matters clinically as well.
Log every turn-away with a reason code: no clinician with the skill, no one inside the drive-time limit, authorization pending, or patient declined. Reason codes turn a lost referral into a forecast input. Our piece on referral leakage to post-acute care covers the revenue side.
Which metrics should leadership track to measure home-based care capacity?
Track visits per clinician per week, productive-hour share, travel time per visit, referral-to-first-visit time, turn-away rate, vacancy rate, first-year retention, and authorized-visit balance.
| Metric | What it tells you | Common trap |
| Visits per clinician per week | Output per person | Ignores acuity and case mix |
| Productive-hour share | Patient-facing hours divided by paid hours | Needs EVV and payroll joined |
| Travel time per visit | Route and branch design quality | Averages hide rural outliers |
| Referral-to-first-visit time | Whether demand converts into care | Start the clock at referral receipt |
| Referral turn-away rate | Unmet demand | Useless without reason codes |
| Vacancy rate by role and branch | Supply gap | Count unfilled hours, not only open positions |
| First-year retention | Pipeline health | Track by hire-month cohort |
| Authorized-visit balance | Demand ceiling for Medicare Advantage and Medicaid-funded care | Review weekly, not at renewal |
Productivity or staffing ratio: which tells you more about capacity?
Productivity tells you more. Ratios count people, and productivity counts completed visits per paid hour. A branch can hit its staffing ratio and still turn away referrals if drive time and documentation absorb the week. Use the ratio to set hiring targets and productivity to check that hires become visits. Weight each visit by acuity, because a wound care visit and a medication check take different time.
How do home-based care networks forecast demand and capacity across branches?
They forecast demand and supply on the same data and calendar, then rebalance every week. Demand comes from referral volume, hospital discharges, census, and case mix. Supply comes from clinician hours net of leave, vacancy, and ramp-up.
- Unify the inputs. Join EVV punches, scheduling history, HR and payroll, EHR case mix, the referral log, and authorizations.
- Forecast demand by branch and discipline on rolling 13-week and 12-month views.
- Forecast supply. Count clinician hours net of leave and vacancy, and treat first-year hires at partial productivity.
- Add constraints. Skills and licenses, drive-time limits, continuity of care, patient preferences, and overtime caps.
- Balance and review. Move work to where waitlists and idle hours coexist, compare forecast with actual visits weekly, and retrain the model.
Hospitals run the same forecast-then-schedule logic, and our piece on hospital staffing and demand forecasting shows the pattern. Home-based care adds drive time, visit continuity, and payer authorizations.
What data do you need before AI scheduling tools deliver results?
You need linked data from scheduling, EVV, HR, EHR, and referral systems, with one identifier per clinician and patient across all of them. Without it, a model optimizes a plan that never happened.
| Data source | Why the model needs it | What breaks without it |
| EVV punches | Actual visit start, end, and travel gaps | Plans built on times that never occurred |
| Scheduling history | What was planned, changed, and cancelled | No measure of schedule volatility |
| HR and payroll | Hire dates, hours, overtime, separations | No retention curves by tenure |
| EHR and OASIS case mix | Acuity and expected visit time | Every visit looks identical |
| Referral log | Demand and turn-away reasons | Forecast reflects only accepted work |
Agencies often hold these in separate systems with no shared key. That is a data engineering and integration job first, and models come second.
How do you balance capacity when some branches have waitlists and others have idle clinicians?
Treat the network as one pool with drive-time limits. Set rules for which clinicians can cover which zip codes, review waitlists and idle hours together each week, and move work before moving people. MedPAC notes that because home health isn’t delivered in a facility, agencies can adjust service areas as local conditions change. Remote options add headroom, yet telehealth or remote monitoring appeared in only 2.2% of FFS Medicare 30-day periods in 2024.
How should you plan hiring and training pipelines over 12 months?
Plan on four horizons, each with its own decision and method.
| Horizon | Decision | Typical method |
| Daily | Who covers an open or new visit | Rule-based matching or AI ranking by skill, distance, and workload |
| Weekly | Schedules and routes for the next one to two weeks | Optimization such as mixed-integer linear programming (MILP) |
| Quarterly | Hiring starts and training cohorts | Demand forecast plus attrition by tenure |
| 12 months | Headcount plan, branch openings, budget | Scenario modeling across payment and referral cases |
MILP picks visit assignments that minimize something, such as travel time, while obeying hard rules like skills, hours, and continuity. Demand and turnover come from separate forecasts, and the optimizer consumes both.
Can predictive analytics identify burnout risk before clinicians leave?
Partly. Models can flag clinicians whose workload, schedule changes, and charting load resemble those of people who later left. They can’t see intent, and research shows that stated intent is an imperfect stand-in for actual exits.
A March 2026 study in the Journal of Occupational and Environmental Medicine followed U.S. nurses and nursing assistants. Burnout affected both turnover intention and actual turnover, while a sense of thriving at work affected intention without raising actual turnover. For modelers, that means training on actual separations from HR records.
| Candidate signal | Where it comes from | Why it matters |
| After-hours documentation | EHR audit logs | Home Health Care News cites documentation burden as a turnover driver |
| Schedule volatility (changes inside 48 hours) | Scheduling system | Scheduling friction is a named turnover driver |
| Weekly hours and overtime | Payroll | Sustained overload |
| Tenure under 12 months | HR | Early exits concentrate among new hires |
| Declined shifts and call-outs | Scheduling system | Early withdrawal |
Candidate features. Validate each against your own separation history before acting on a score.
Use burnout scores to trigger support: rebalance a caseload, publish schedules earlier, or prompt a manager check-in. Keep a human decision-maker, log every alert, and test for bias across shifts and roles. Never tie a score to discipline. Our guide to building trusted agentic AI beyond HIPAA compliance covers these controls.
What does caregiver turnover cost, and how much can analytics prevent?
Turnover cost equals separations times direct replacement cost, plus the visit capacity lost while seats sit empty. Analytics can reduce the share tied to controllable causes such as schedule volatility and uneven workloads. No published benchmark gives a universal reduction rate, so measure yours in a pilot against the 2026 turnover rates above.
How do you evaluate vendor claims about staffing savings and turnover?
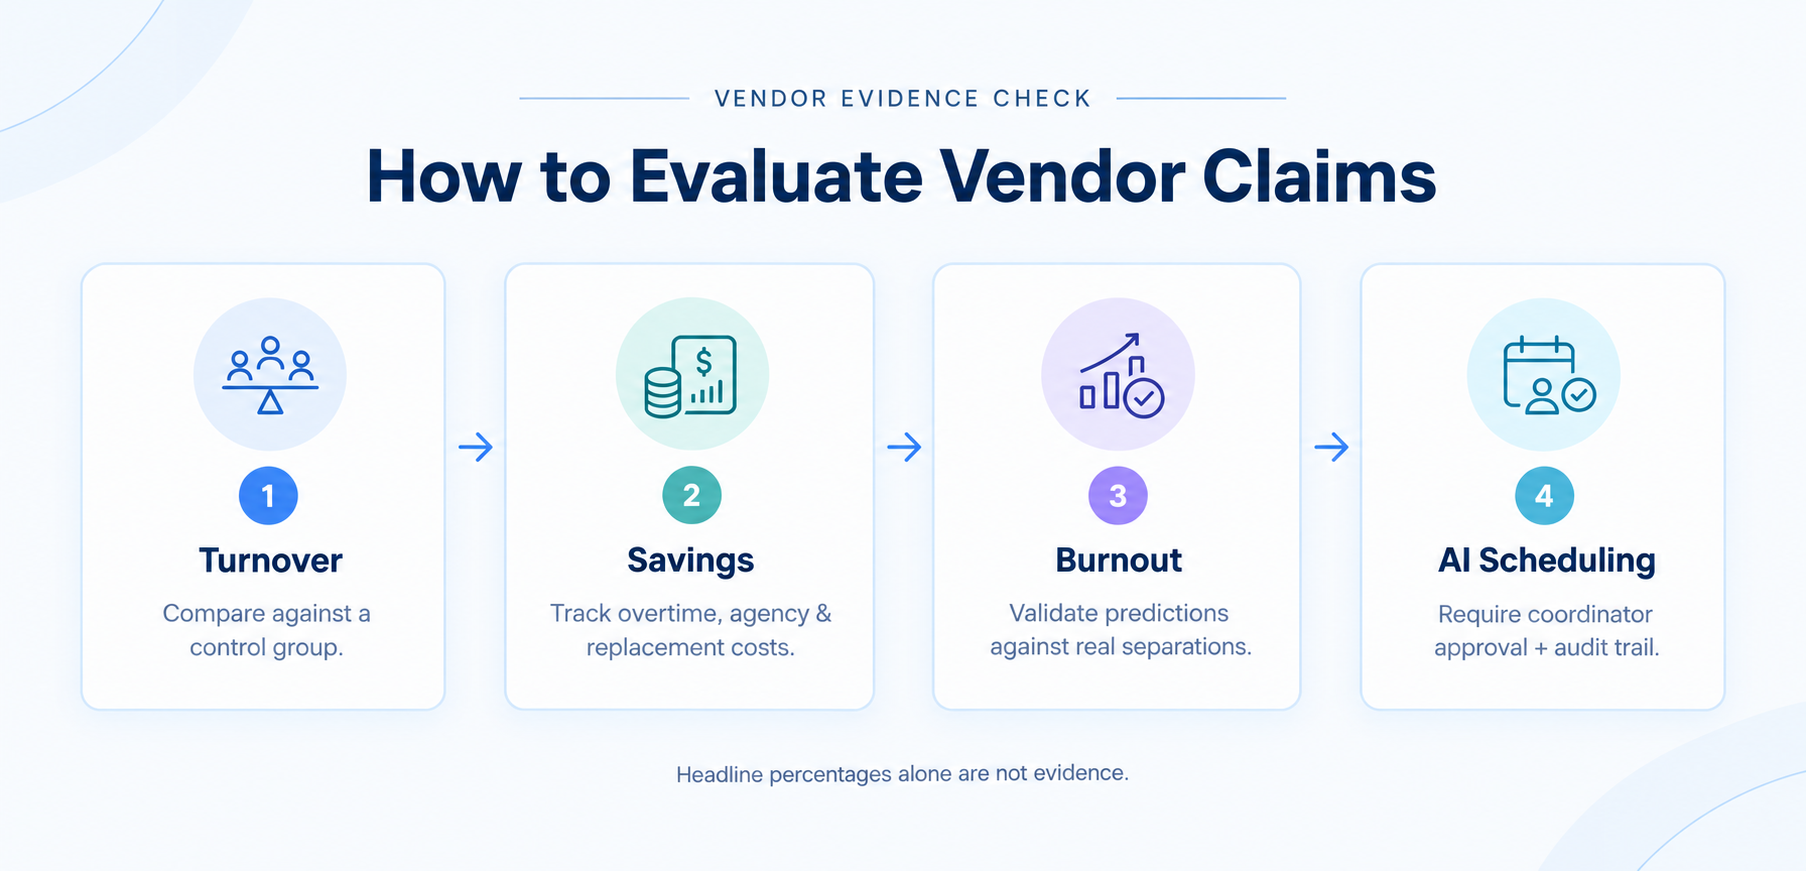
Ask for a control group. Headline percentages alone don’t qualify as evidence.
- Turnover cuts: compared with what, over what period? Look for matched control branches and separations from HR data.
- Cost savings: which lines? Overtime, agency use, and replacement cost should be tracked separately.
- Burnout prediction: validated against what? Ask for a backtest on your own separations.
- AI scheduling: who approves assignments? Expect coordinator approval and an audit trail for each override.
How does AI scheduling reduce caregiver turnover in home care?
It targets churn drivers an agency controls: last-minute changes, mismatched assignments, long drives, and uneven workloads.
- Predictive scheduling in home health: publish schedules one to two weeks ahead, built on the demand forecast.
- Better matches: rank caregivers by skill, language, distance, and continuity with the patient. Our write-up on AI-powered patient-caregiver matching shows how this works in home care.
- Shorter drives: cluster visits by geography.
- Fair load: balance acuity and hours so no single clinician absorbs the hard cases.
Agents can draft schedule options and flag conflicts while coordinators approve each change, the model described in our framework for agentic AI in home care operations. Evidence for turnover reduction is still mostly vendor-reported, so pilot with a control branch before you scale.
How do Medicare payment changes and Medicare Advantage affect staffing forecasts?
Payment sets the labor budget, and Medicare Advantage shapes visit volume. Build forecasts on scenarios, because the CMS proposal and MedPAC’s recommendation point in different directions.
| Item | Status | Planning implication |
| CY 2027 payment update | CMS proposes a 2.4% aggregate increase, about $420 million | Base case for the labor budget |
| Temporary base-rate reduction | CMS proposes a 3.0% reduction again for 2027 | Keep recoupment in margin assumptions |
| MedPAC recommendation | 7% cut to the 2026 base rate for 2027, which needs Congress | Downside scenario |
| Palliative care | CMS seeks comment on palliative care under the home health benefit | New demand source and overlap with hospice teams |
Sources: CMS CY 2027 Home Health PPS Proposed Rule Fact Sheet (July 1, 2026); MedPAC March 2026 Report to the Congress. The rule is proposed, so check the final rule when it publishes.
Read the CMS proposed rule fact sheet for the full detail before you lock a budget. For Medicare Advantage, forecast approved visits and not referred patients, and monitor authorization balances weekly. Quality scores add a second link between staffing and revenue, because timely starts and consistent caregivers drive both.
How do hospice and home health teams plan shared nursing capacity?
Plan both from one workforce model with separate demand curves. Hospice demand follows census and stay-length bands. Home health demand follows referrals and 30-day payment periods.
Agencies that run both services can pool nurses and aides. BLS notes that aides in certified home health or hospice agencies must complete formal training and pass a standardized test, so credentials already overlap. CMS’s interest in palliative care under the home health benefit pulls the two services closer.
Start from the hospice census forecast. Our guide to hospice length of stay forecasting shows how stay bands set visit demand. Feed those bands and the home health demand forecast into one scheduling model, so two teams never promise the same clinician hour twice.
Forecasts earn their keep when each one routes to a named owner. A visit-demand spike should reach the scheduler with a proposed coverage list, and the scheduler approves it.
How do you start a home health staffing analytics program in 90 days?
Start with two or three branches and one question: where does visit capacity leak?
- Days 1 to 30, build the baseline. Join EVV, scheduling, HR, and referral data. Write one data dictionary for productive hours, vacancy, and turn-away.
- Days 31 to 60, size the leaks. Report productive-hour share, drive time, schedule volatility, and first-year retention by branch. Pick the biggest leak.
- Days 61 to 90, pilot one lever. Test predictable schedules, matching, or caseload rebalancing in one branch, with a control branch alongside.
- After day 90, decide with data. Compare pilot and control on separations, visits per clinician, and referral conversion. Scale what worked.
Workforce planning software helps when it reads from governed data and leaves scheduling authority with your coordinators. A predictive analytics partner can build the models, and your team should own the definitions and the approval step.
Final Thoughts
Networks that treat capacity as a measured, forecast number make better hiring, scheduling, and payer decisions. Start with one branch, one leak, and one control group. The next referral your team declines will then trace back to a cause you can fix.
This article is part of our series on predictive analytics for hospice operations, which extends the same governed data foundation from hospice to the wider home-based care network.