














Summary
Hospice predictive analytics works only when census, claims, and cost report data share governed definitions. This guide shows hospice care agencies how to forecast cap exposure, census, staffing, and payment updates on data that a board, auditor, or buyer can trace.
Introduction
Picture the Monday leadership meeting. Finance projects a cap liability of $380,000. Clinical operations reads the same census and sees no exposure at all. Billing counts beneficiaries differently from Medicare’s own reports. FY 2027 began on October 1 with a cap amount of $36,174.75 per beneficiary, so the gap between those three answers now carries a fresh number.
Predictive analytics for hospice operations starts with governed data. This article builds on the foundation in How Hospice Organizations Build a CMS-Ready Data Foundation and shows what becomes possible once that foundation exists: forecasting, eligibility screening, staffing models, and reporting that stands up to questions.
It’s written for CFOs, COOs, and CEOs at hospice care agencies who have to stand behind a number in front of a board, an auditor, or a buyer. Each section ends with a practice you can start this quarter.
Why do hospice forecasts fail when data definitions differ across teams?
Each team measures a different thing under the same name. A hospice forecast pulls from the clinical record, the billing system, HOPE submissions, the cost report, and Medicare’s own cap reports. Every source defines census, beneficiary, and length of stay a little differently, and the forecast inherits each disagreement.
| Metric | Clinical record | Billing system | Governance fix |
| Census | Patients on service at midnight | Patients with paid days in the period | One published definition of average daily census, with the source named |
| Beneficiary count | Admissions logged in the EMR | Unique patients on submitted claims | Reconcile to the Medicare PS&R and hospice cap reports before use |
| Live discharge | Reason chosen by the clinician | Discharge status code on the claim | Map both to one reason list and have a steward review exceptions |
| Length of stay | Days since admission | Days billed per election | Label every chart as current-election or lifetime stay |
Typical definitions. Your own data dictionary should record the exact version each team uses.
Timing adds a second layer. Claims settle slowly, and MedPAC waits 15 months after a cap year ends before it estimates cap results. A forecast built on the first claims run will move as claims mature. Lineage is the third layer. When the number lives in a spreadsheet that three people edit, nobody can say which version the board saw.
A hospice data governance framework settles these arguments once. It names one steward per metric, writes the definition down, and runs the check inside the pipeline. Publish the cleansed result in the gold layer, and every team pulls the same number.
What is the hospice aggregate cap, and how is it calculated?
The aggregate cap limits total Medicare payments to a hospice in a cap year. Multiply the beneficiaries a hospice served by the cap amount and you get the most it can keep. Anything above that returns to Medicare. For the FY 2027 cap year the amount is $36,174.75, up 2.3% from $35,361.44 in FY 2026. A hospice that counts 1,000 beneficiaries has a ceiling of $36,174,750.
Two details shape every forecast. The cap applies across the whole patient population, so short stays create room for long ones. MedPAC calculates that the 2026 cap equals about 178 days of routine home care at a wage index of 1.0, and its worked example shows half a hospice’s patients staying 30 days while the other half average up to 335 days before the hospice crosses the line. The cap also carries no geographic adjustment.
The calendar matters as well. The FY 2026 cap year closed on September 30. CGS Administrators, a Medicare administrative contractor, tells hospices to file a self-determined cap three to five months after year end, which puts the window between December 31 and February 28. Beneficiary counts for that filing come from CMS’s PS&R and hospice cap reports, so those reports belong in your forecast pipeline from day one.
How do you forecast aggregate cap exposure every quarter?
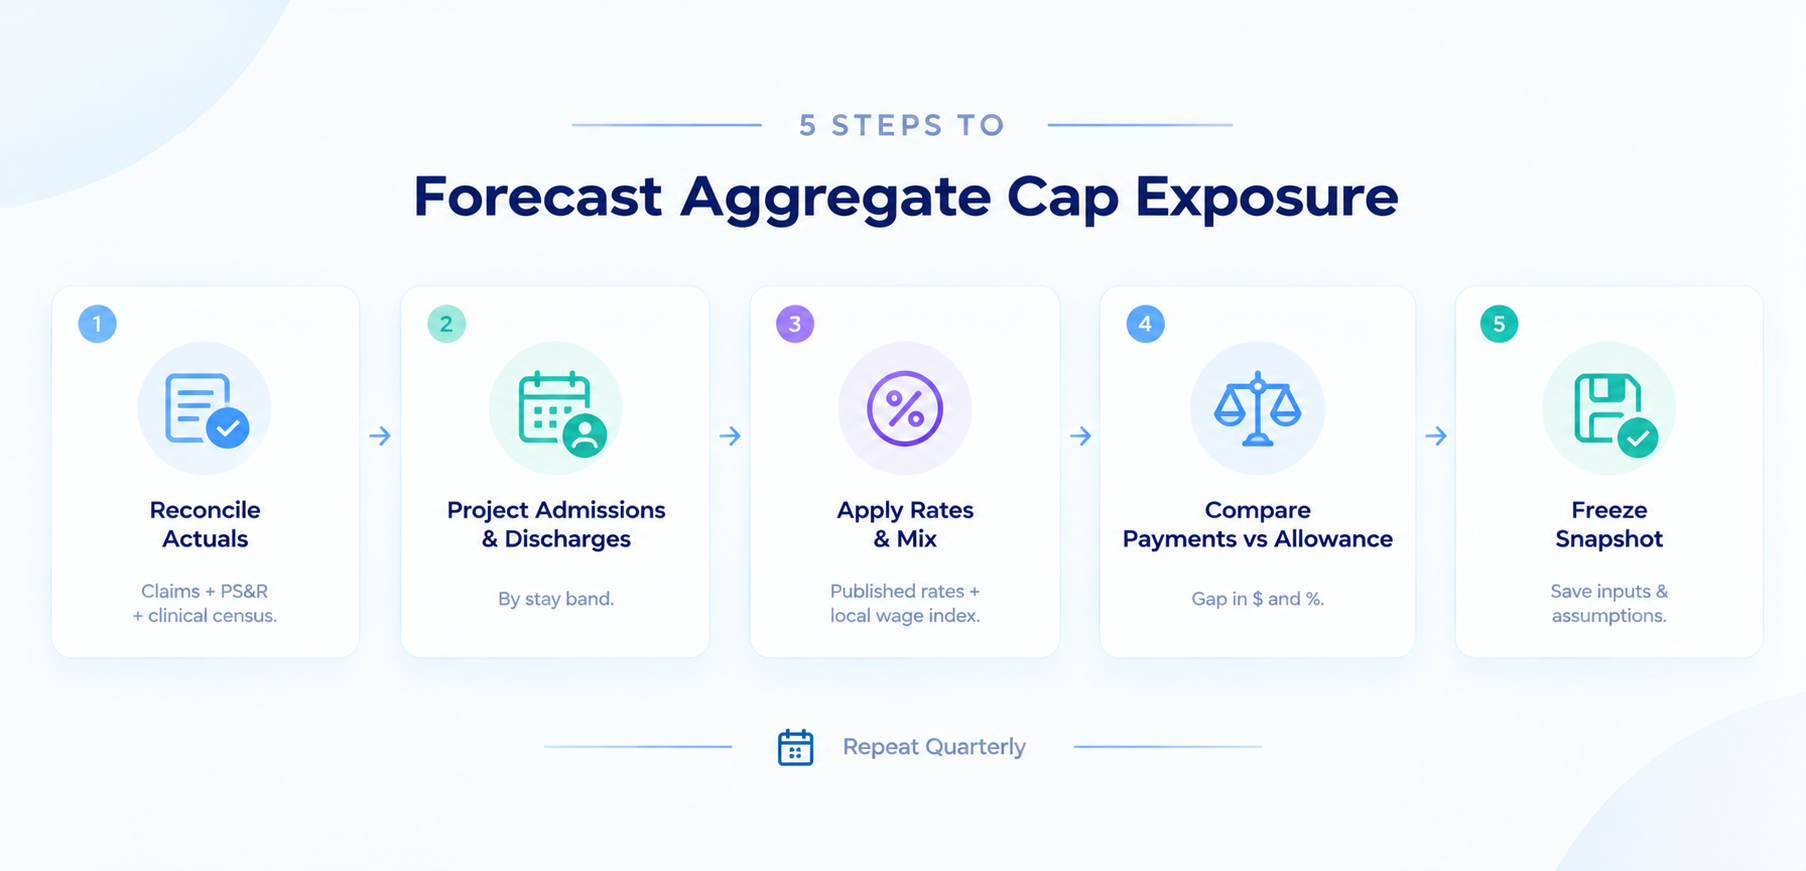
Project total Medicare payments for the cap year, project the cap allowance from your beneficiary count, and compare the two. Then repeat it on a fixed schedule. Five steps keep the process repeatable:
- Anchor on reconciled actuals. Start from paid claims and PS&R beneficiary counts to date, matched to the clinical census.
- Project admissions and discharges by stay band. Short, typical, and long stays behave differently, and they move cap allowance in opposite directions.
- Apply current rates and level-of-care mix. Use the published payment rates and the wage index for your area.
- Compare payments with allowance. Report the gap in dollars and as a share of the allowance.
- Freeze the snapshot. Save the inputs and assumptions with each run so anyone can reproduce the number later.
How often should a hospice project its cap liability?
Quarterly is the floor. Move to monthly in the last two quarters of the cap year, and run one more projection after the year closes and before the self-determined filing goes out. The reopening rule is the reason to keep every snapshot, because contractors can reopen a cap calculation for up to three years, according to MedPAC.
How do length of stay and live discharges change cap risk in a forecast?
Length-of-stay mix drives cap risk more than any other input, and the distribution is wide. In CMS’s April 2026 hospice monitoring report, 55.5% of FY 2025 stays ended within 30 days while 17.6% ran past 180. Medicare hospice payments reached $30.3 billion that year, so the long tail carries real money.
| Lifetime hospice stay, FY 2025 | Share of Medicare fee-for-service beneficiaries |
| 1 to 4 days | 20.4% |
| 5 to 10 days | 16.4% |
| 11 to 30 days | 18.7% |
| 31 to 60 days | 10.9% |
| 61 to 90 days | 6.0% |
| 91 to 180 days | 10.0% |
| 181 days or more | 17.6% |
Source: CMS Hospice Monitoring Report, April 2026. Beneficiaries whose hospice stays had ended.
That spread is why hospice length-of-stay forecasting works best by band and diagnosis group, with survival probabilities at set horizons. A single average hides both the short stays and the long ones, and each pulls the cap in a different direction. Length-of-stay forecasting turns the distribution into a patient-level view that finance can roll up.
Live discharges belong in the same model. CMS reports a live discharge rate of 19.1% for FY 2025, and revocations (35.8%) plus patients no longer deemed terminally ill (31.1%) made up two-thirds of live discharges and transfers. Each one changes the beneficiary count and the payments that follow. MedPAC adds that above-cap hospices show longer stays and higher live discharge rates than below-cap hospices, even for patients with similar diagnoses, so reviewers read the two patterns together.

How should a hospice forecast treat the FY 2027 payment update?
Treat it as a scenario, because three outcomes sat on the table this year. In its March report, MedPAC recommended 17 to 0 that Congress eliminate the FY 2027 update. In July, CMS finalized a 2.3% update, worth an estimated $755 million across the benefit. A hospice that misses quality reporting requirements takes four percentage points off that figure, which leaves a 1.7% reduction.
Reporting failures are common enough to model. CMS found that 20.37% of hospices were non-compliant in FY 2026, and HOPE records with 2026 target dates drive the FY 2028 update. That ties your revenue forecast to HOPE timeliness data. The cap amount also moves with the update percentage, so the same assumption touches both revenue and cap room.
| Scenario | Payment update | Effect on $20 million in Medicare payments |
| Full update finalized by CMS | 2.3% increase | $460,000 increase |
| Zero update (MedPAC recommendation) | 0% | No change |
| Quality reporting miss | 1.7% reduction | $340,000 reduction |
Hypothetical hospice with $20 million in annual Medicare payments at prior-year rates. The gap between the first and last rows is $800,000.
How do you connect HOPE, claims, and cost report data into one forecast?
Start with the sources and name an owner for each:
- Clinical record: census, visits, level of care, diagnosis, and HOPE assessments.
- Billing and claims: paid days, payments, and PS&R reconciliation.
- iQIES submission status: accepted and late HOPE records, which feed the payment update scenarios.
- Cost report: cost per day and margin by service line.
- CMS publications: payment rates, the cap amount, and the wage index.
The cost report deserves extra scrutiny. MedPAC says irregularities in how some hospices report revenue and expenses on cost reports keep it from calculating reliable all-payer margins. Medicare margin forecasts depend on the same fields, so hospice cost report data accuracy is a governance task with a named steward.
Integration comes first. If EMR, billing, and CMS reporting data never meet in one place, every forecast starts with a manual merge. Our guide to connecting EHR, billing, and CMS reporting covers that layer and shows how existing systems can feed it.
How do hospices forecast census and revenue?
Census forecasting combines three moving parts: new admissions, the survival curve of patients already on service, and discharges. Revenue follows from census days, level-of-care mix, and the payment rates in force. Admissions are the least governed part of that chain. A referral that waits days for a manual eligibility check and a physician signature becomes an admission on a different date, and that date can land in a different month, or a different cap year, than the forecast assumed. Teams that cut referral intake delays with automated eligibility screening hand the forecast cleaner admission dates, so intake noise stops showing up as census error.
Can predictive models improve census forecasting, or is data quality the real bottleneck?
Both matter, and the order matters more. A model trained on conflicting census definitions produces confident, wrong numbers. Once definitions and lineage are in place, healthcare predictive analytics adds real value: survival probabilities by horizon, stay-length bands, and live discharge risk roll up into a monthly census and cap projection. The benefit is earlier warning, and in hospice that means seeing a cap gap in June while there’s still time to act.
AI in hospice care follows the same sequence. Predictive modeling earns trust when each prediction carries a source, a date, and an error band that leadership can read. AI-powered automation for hospice can then run the routine checks, such as reconciling beneficiary counts to PS&R each month and alerting a steward when the cap gap crosses a set threshold. The model proposes, and people decide.
How do staffing and capacity plans fit into the forecast?
A census forecast doubles as a workload forecast. Stay-length bands show which patients will need heavier nursing and social work visits in their final days and which will need steady aide hours for months. For networks that run hospice alongside home health and personal care, staffing and capacity planning analytics ties caregiver supply to that demand curve, so a scheduler sees a shortfall weeks before a shift goes unfilled. The inputs are the same governed census and stay forecasts, so no second data build is needed.
Which data governance controls make a hospice forecast defensible?
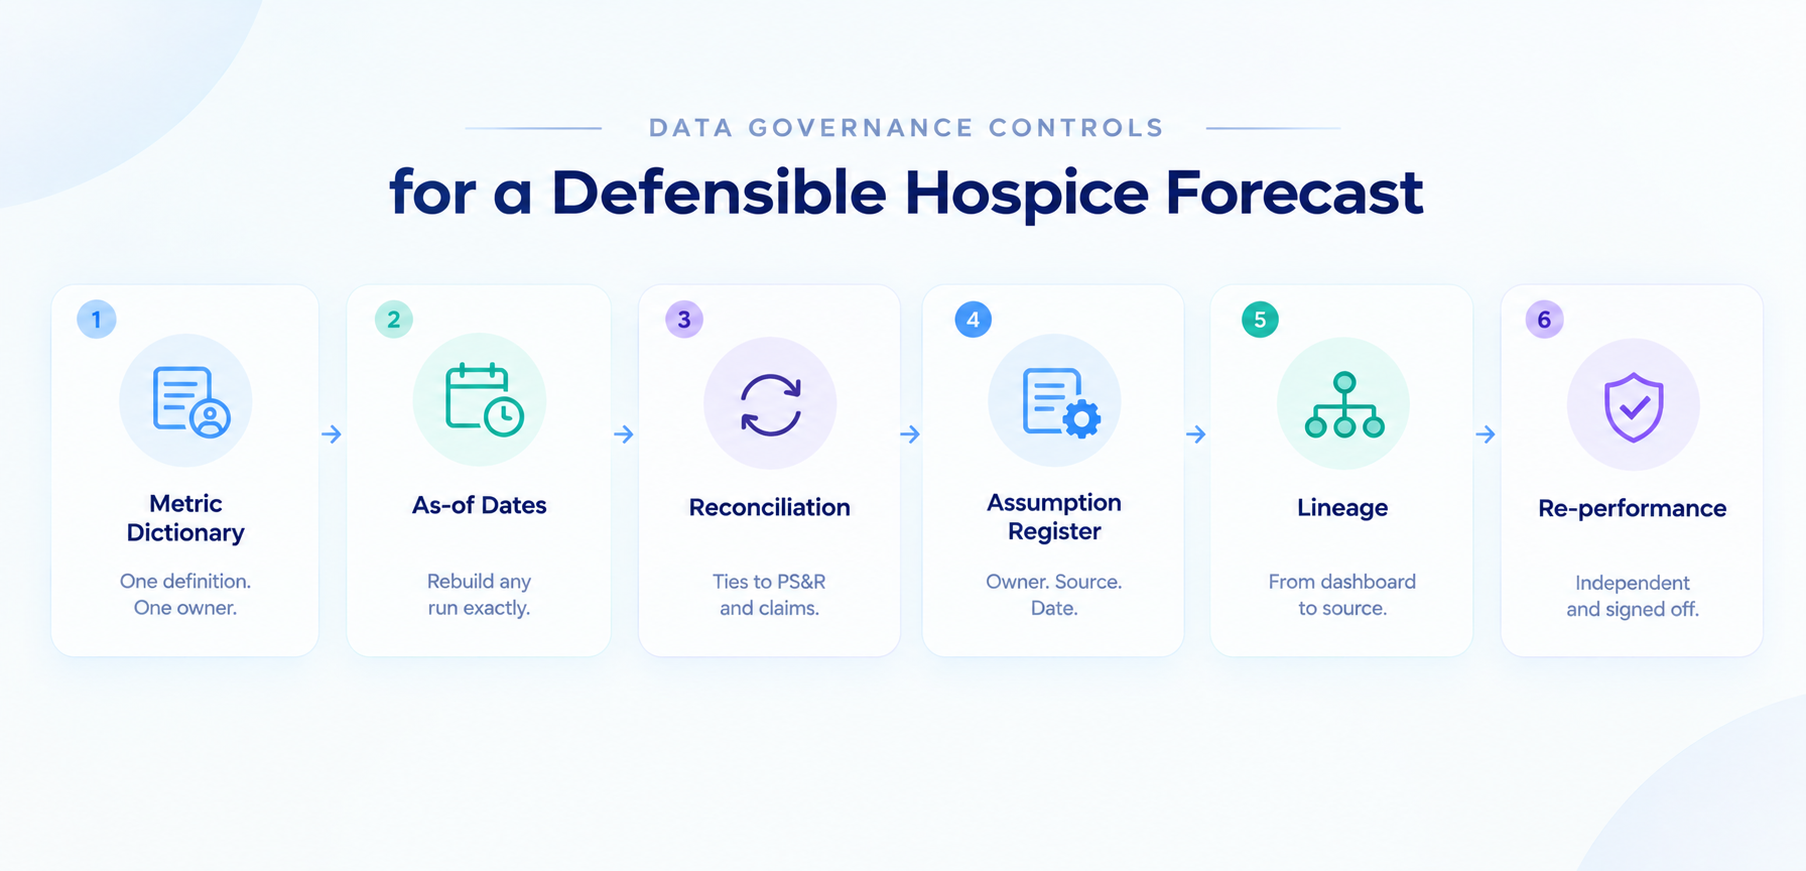
When CMS, an auditor, or a buyer questions an assumption, six controls decide whether you can answer in an hour or need a month:
- A metric dictionary with named owners. Every KPI has one definition, one steward, and a version history.
- As-of dates on every input. Each forecast run saves the data cut it used, so last quarter’s number can be rebuilt exactly.
- Reconciliation before release. Beneficiary counts and payments tie to PS&R and claims before any cap figure leaves finance.
- An assumption register. Payment update, stay-length mix, live discharge rate, and admissions each get an owner, a source, and a date.
- Lineage from dashboard to source. Anyone can trace a board-pack number through every transformation, as we describe in our piece on audit-ready data lineage.
- Independent re-performance. Someone who didn’t build the model reruns it twice a year and signs off. It’s the test of whether a new CFO or an outside reviewer could reproduce your numbers.
Scenario models leadership should run for FY 2027
Run at least four: the full 2.3% update, a quality reporting miss, a shift in stay-length mix toward longer diagnoses, and a rise in live discharges. The cap amount is set at $36,174.75 for the year, which makes it the one input you can lock.
How should forecasts reach the board?
Compress the results into one page: projected cap position, average daily census trend, margin, and the three assumptions that move them most, with the data cut date printed at the top. Add utilization and non-hospice spending metrics so directors see what CMS sees, since CMS now publishes provider-level Service and Spending Variation Index scores. Audit-ready dashboards carry the source and data cut date on every tile, so a number shown in the boardroom can be defended in a CMS review.
How does an unaccrued cap liability affect hospice valuation in due diligence?
Buyers re-perform the cap calculation from claims, and they usually treat any shortfall in your accrual as a debt-like item. The result is typically a lower price, an escrow, or an indemnity. The exposure also reaches backward, because contractors can reopen cap calculations for up to three years.
What margins should a forecast be tested against?
MedPAC projects an aggregate fee-for-service Medicare margin of about 9% for hospices in 2026, and it cited strong margins when it recommended no update for FY 2027. An average hides the spread. For a hospice with a high share of long stays, the cap can take back most of that margin, which is why the forecast should show margin before and after repayment.
Forecast the full repayment as owed. Diligence teams ask for the cap workpapers, the PS&R reconciliations, and the assumption history. If those exist as dated, governed files, the conversation gets shorter. If they live in someone’s inbox, expect the buyer to build a worst case on your behalf.
What does a mature hospice forecasting process look like?
| Dimension | Spreadsheet-based process | Governed process |
| Definitions | Each team keeps its own | One dictionary with named owners |
| Data refresh | Manual exports, merged by hand | Scheduled loads reconciled to PS&R and claims |
| Assumptions | Cell comments and memory | Register with owner, source, and date |
| Traceability | File names like final_v7 | Lineage from board number to source |
| Reproducibility | Depends on the author | Any reviewer can rerun from a saved snapshot |
Hospice budgeting and forecasting software works best when it reads from the governed column, because a faster tool on conflicting data produces conflicting numbers faster.
Final Thoughts
Your next forecast will be questioned by a board member, a reviewer, or a buyer. The open question is whether you can answer in an afternoon. The FY 2027 cap year opened on October 1, and the self-determined filing for FY 2026 comes due by February 28. That leaves roughly four months to reconcile beneficiary counts, freeze assumptions, and write the methodology down.
Start with one number, the cap projection. Make it traceable from the board page to the claim. Every other forecast you build, from census to staffing, will follow the same pattern.