


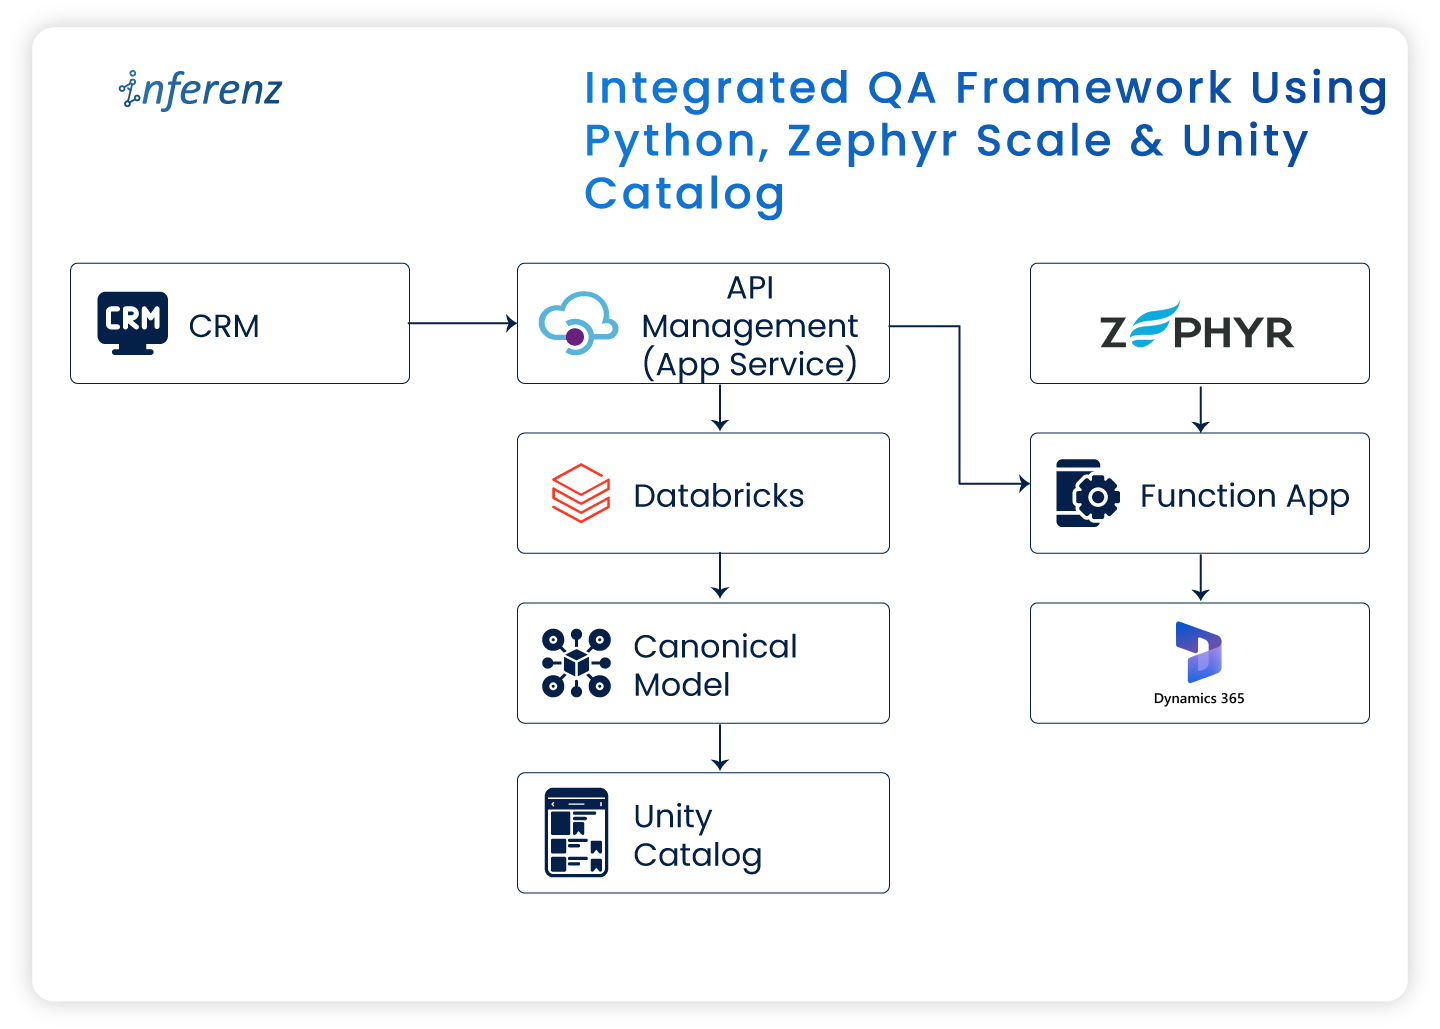
 Integrated QA framework using Python, Zephyr Scale & Unity Catalog
Introduction
Quality Assurance (QA) in the software world has moved beyond functional testing and interface validation. As modern enterprises shift toward data-centric architectures and cloud-native platforms, QA now involves ensuring data accuracy, integrity, governance, and system compliance end to end.
In a recent enterprise project, I worked on migrating a legacy Customer Relationship Management (CRM) system to Microsoft Dynamics 365 (MS D365). It wasn’t merely a technology shift. It involved moving large data volumes, aligning new business rules, setting up strong governance layers, and ensuring uninterrupted business operations.
In this article, I’ll share how QA was handled across this transformation using Zephyr Scale for test management, Python for automation, and Databricks Unity Catalog for governance and access control.
QA challenges in migrating to Microsoft Dynamics 365
Migrating from a legacy CRM to a modern cloud platform brings unique QA challenges. The main focus areas included:
| Focus Area | QA Objective | Common Issues |
| Data Validation | Ensure data integrity and accuracy post-migration | Missing, duplicate, or corrupted records |
| Functional Testing | Validate end-to-end workflows across Bronze → Silver → Gold layers | Breaks in business logic or incomplete process flow |
| Integration Testing | Verify KPI accuracy in downstream systems | Data mismatch or inconsistent calculations |
This was my first experience in a hybrid QA setup—where data engineering and cloud CRM validation worked together. Automation became essential from the start.
Test management with Zephyr Scale in Jira
We used Zephyr Scale within Jira to manage all QA activities. It ensured complete traceability from test case creation → execution → defect resolution.
The test planning followed an iterative Agile structure:
| Sprint | Phase | Description |
| Sprint 1 | System Integration Testing (SIT) | Validation of data flow, transformations, and business rules |
| Sprint 2 | User Acceptance Testing (UAT) | Final stage readiness checks before production deployment |
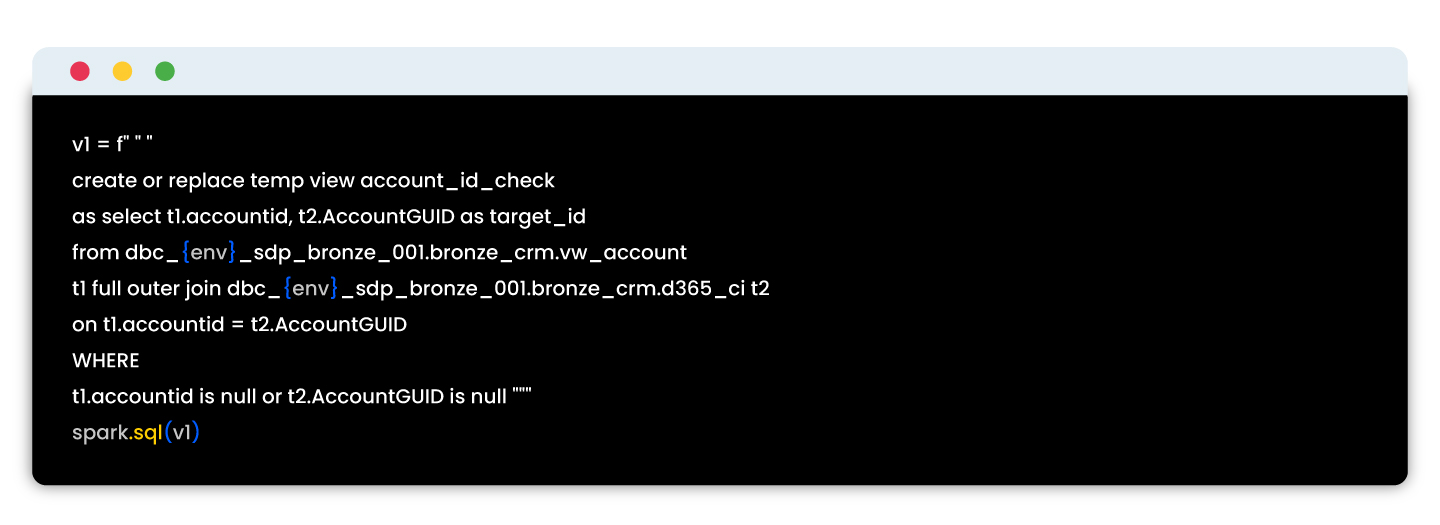
Sample migration test case
Objective: Validate that data from the Bronze layer is accurately transferred to the Silver layer.
Steps:
- Query record counts in the Bronze schema.
- Query corresponding counts in the Silver schema.
- Compare totals and sample values.
- Confirm no data loss or duplication.
Zephyr Scale offered complete visibility—allowing both QA and business teams to align quickly and demonstrate readiness during go-live reviews.

Writing effective test scenarios and cases
In a data migration project, QA must cover both systems—the old CRM and the new MS D365—along with the underlying Databricks Lakehouse layers.
The following scenarios formed the backbone of our testing effort:
- Data validation: Ensuring every record from the old subscription is fully and accurately migrated.
- Schema validation: Confirming the data flow through Bronze → Silver layers, with cleansing and normalization (3NF) applied.
- KPI validation: Verifying 16 business KPIs for accuracy, completeness, and correct duration (annual or quarterly).
- Governance validation: Checking access permissions, lineage, and audit logs for compliance.
This structured approach ensured coverage across the technical and business sides of the migration.
QA automation with Python
Manual validation quickly became impractical with large datasets and frequent syncs. Automation was the only sustainable approach.
Automated checks included:
- Record counts between schemas/tables/columns
- Schema conformity checks in migrated tables
- Data Validation from Bronze to Silver to Gold
- Naming convention checks
- Storage location validations
- KPI Calculations
This automation saved countless hours and ensured we caught discrepancies quickly.
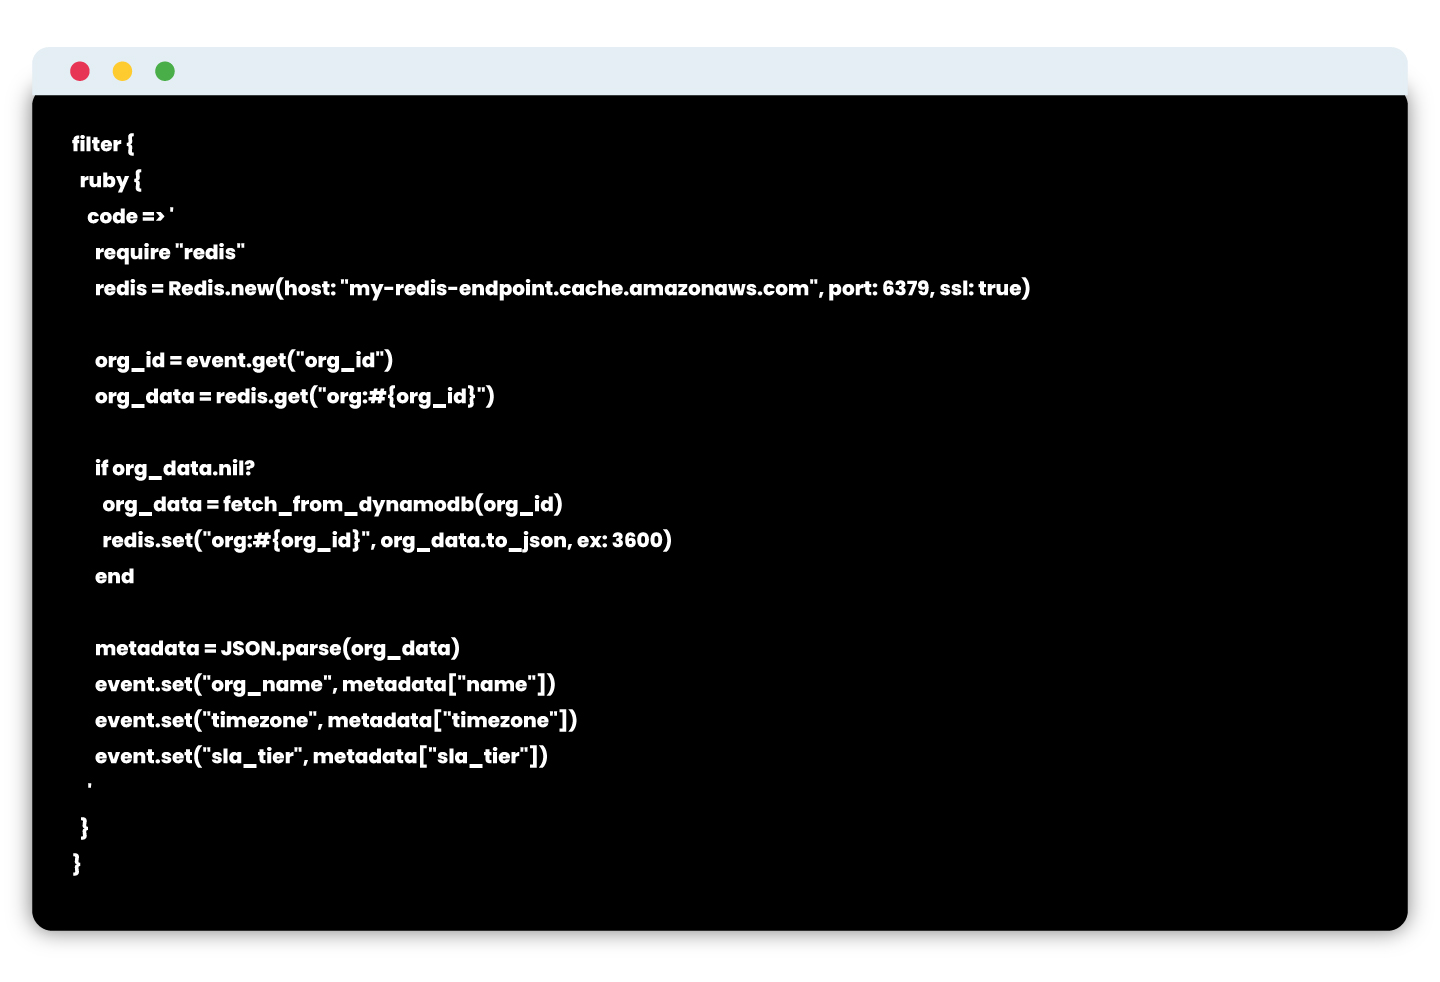
Sample script:
These automated tests reduced QA time, enabled early detection of errors, and ensured reliable validation across migration batches.
Unity Catalog: Governance in the data pipeline
Data governance was as important as data accuracy in this project. Using Databricks Unity Catalog, we centralized security, access, and lineage validation for all datasets.
As part of QA, we validated:
| Governance Check | QA Objective |
| Access Control | Ensure only authorized users can view Personally Identifiable Information (PII). |
| Schema Locking | Validate that schema versions remain consistent across deployments. |
| Audit Logging | Confirm all data access events are recorded and retrievable. |
Testing with Unity Catalog reinforced compliance while maintaining transparency across teams.
End-to-end QA workflow in the migration
Each tool contributed to the overall assurance model:
| Step | Tool Used | QA Outcome |
| Test scenario creation | Zephyr Scale + Jira | Linked to user stories for visibility |
| Data validation | Python automation | Verified migration accuracy |
| Governance checks | Unity Catalog | Validated access control and data lineage |
| Reporting | Zephyr dashboards | Weekly QA progress reports |

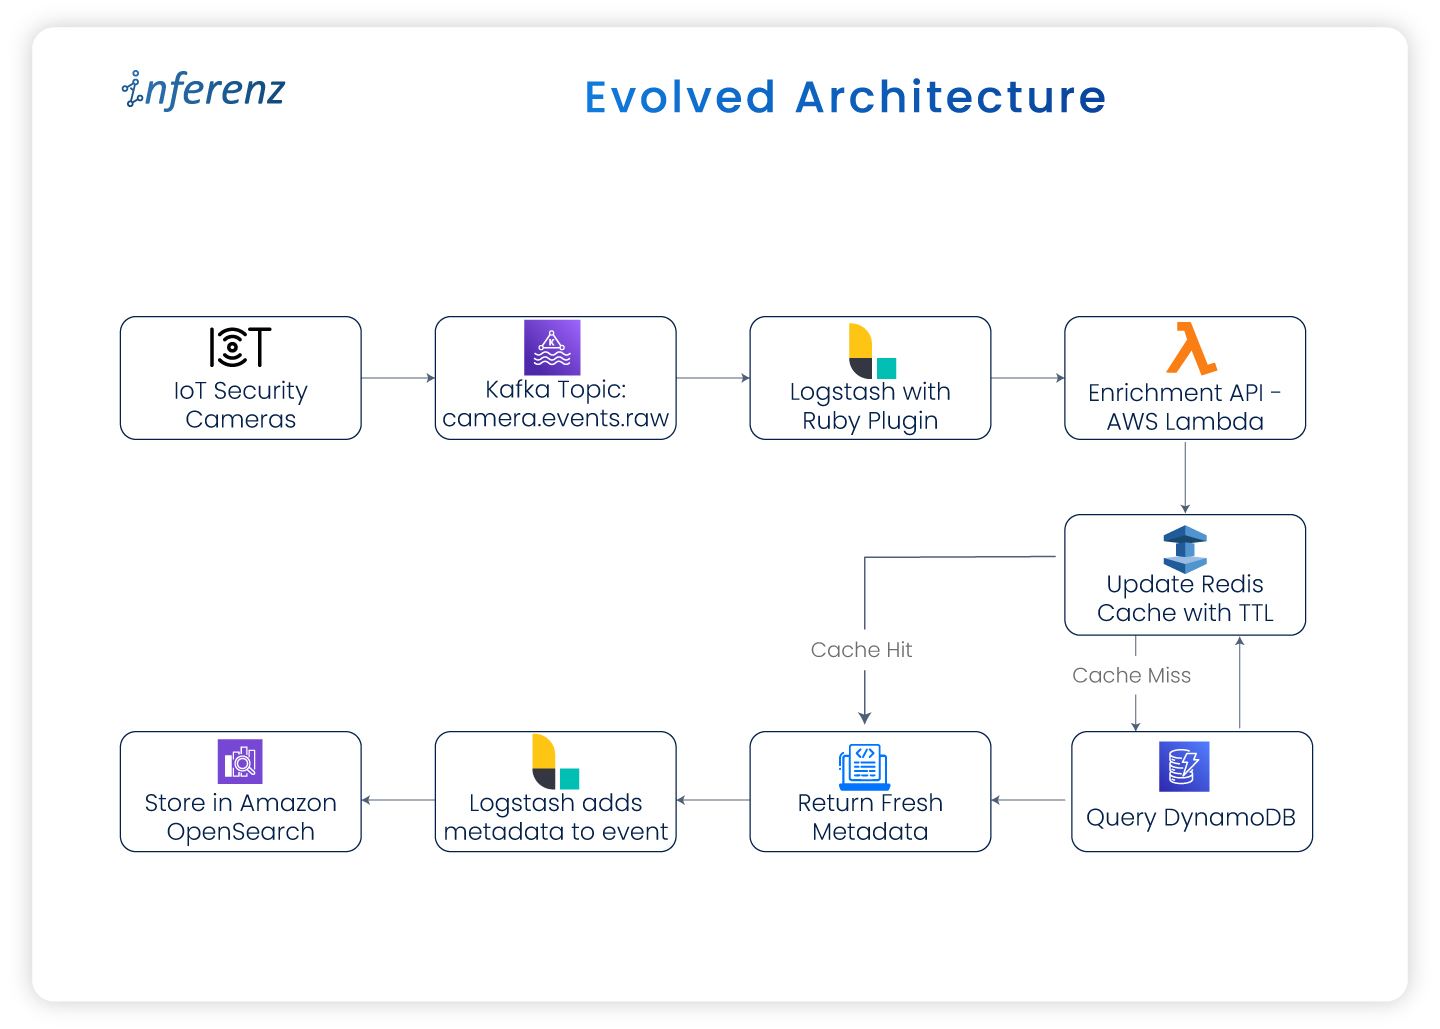
Workflow overview
| Stage | Process | Primary Tool | QA Outcome |
| 1 | Data migration from legacy CRM | Migration scripts | Source-to-target data movement |
| 2 | Data lake layering | Databricks (Bronze → Silver → Gold) | Data transformation and enrichment |
| 3 | Automated validation | Python | Record and schema verification |
| 4 | Governance enforcement | Unity Catalog | Role-based access, lineage, and audit logging |
| 5 | Test management | Zephyr Scale | Test execution tracking and reporting |
| 6 | Issue management | Jira | Ticketing, sign-off, and visibility |
This structure built confidence through traceability and consistent automation cycles.
Key takeaways from the CRM to D365 transition
![]()
- Treat CRM migration as a business transformation, not just data movement.
- Use Zephyr Scale for transparent test tracking.
- Automate frequent checks using Python to maintain speed and precision.
- Leverage Unity Catalog for governance assurance and compliance.
Final thoughts
Migrating to Microsoft Dynamics 365 while building a modern data stack highlighted how deeply QA intersects with data engineering and governance.
By combining Zephyr Scale, Python automation, and Unity Catalog, we achieved a QA framework that was:
- Structured for traceability,
- Automated for efficiency, and
- Governed for compliance.
This foundation now serves as a blueprint for future enterprise migrations, ensuring data trust from ingestion to insight.


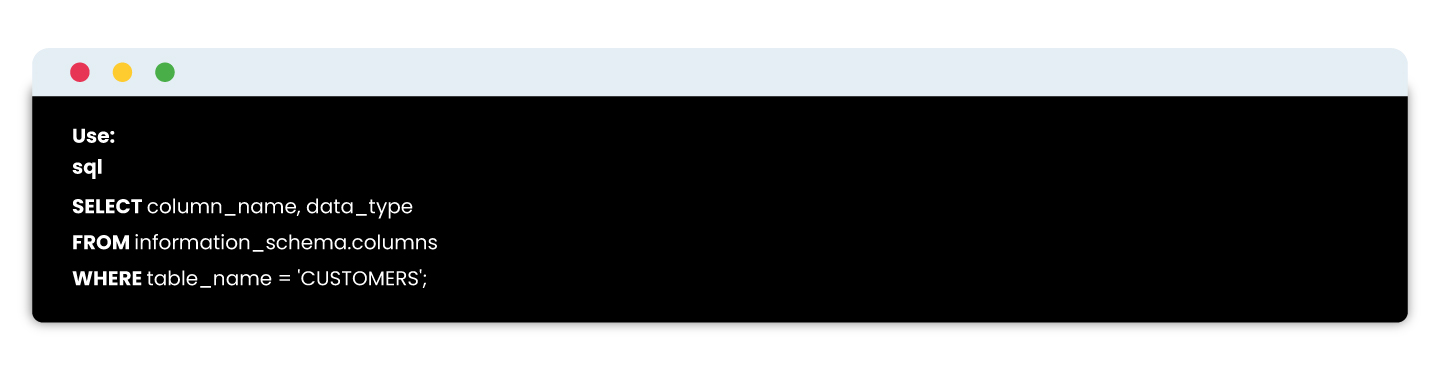
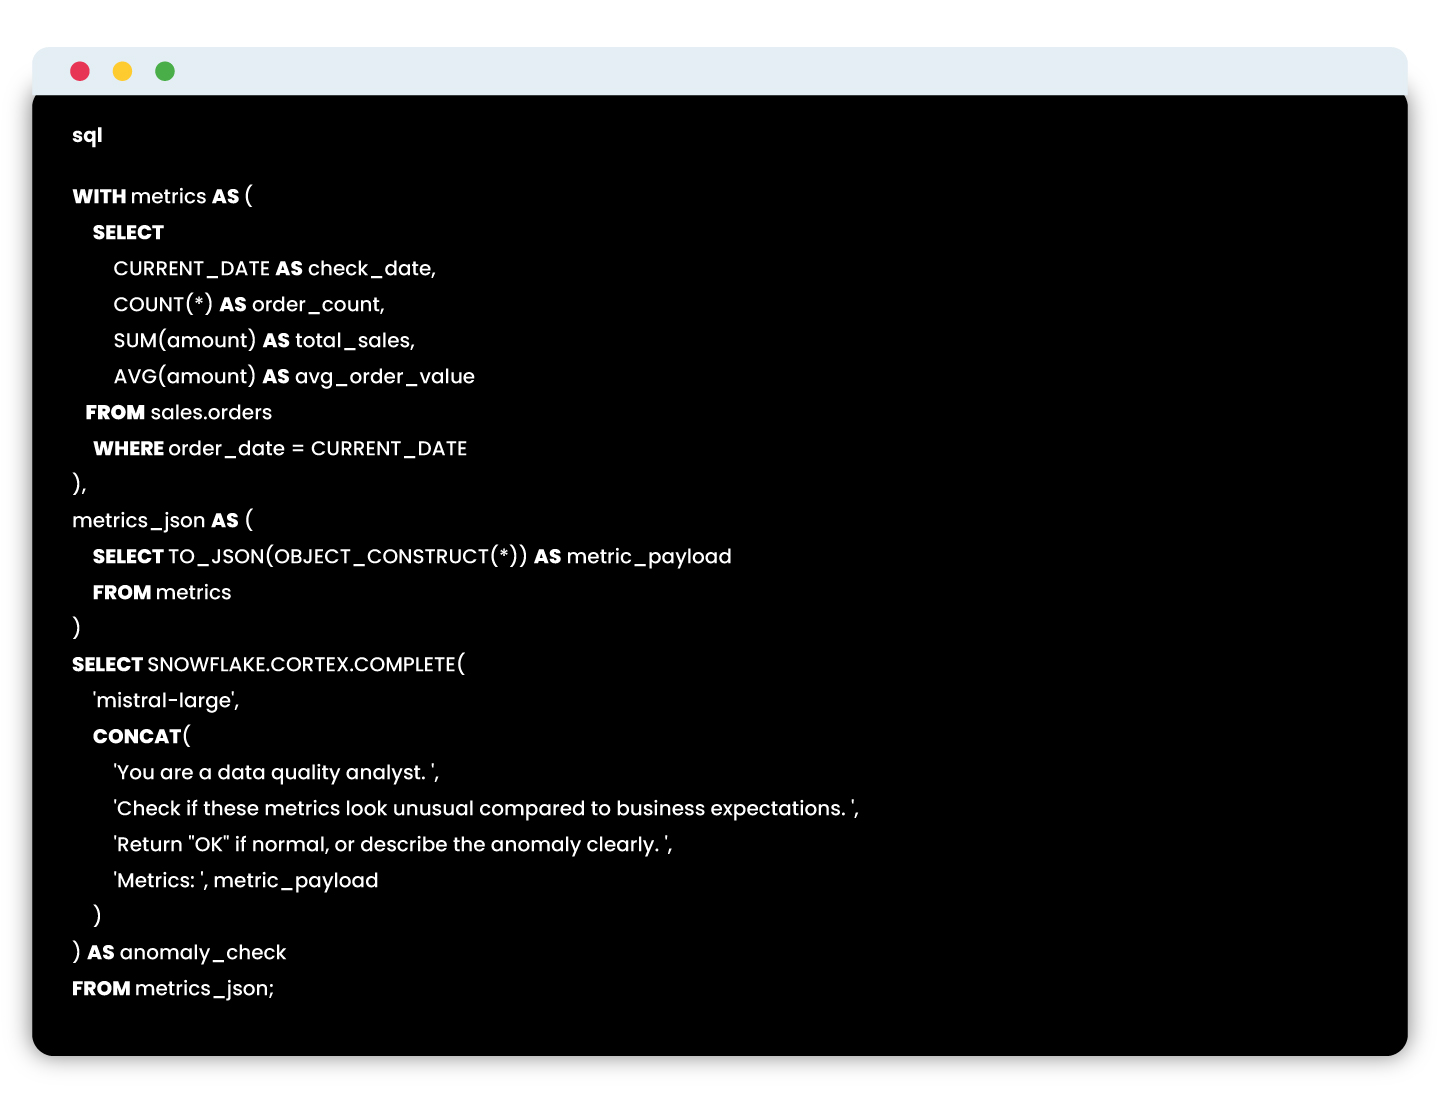
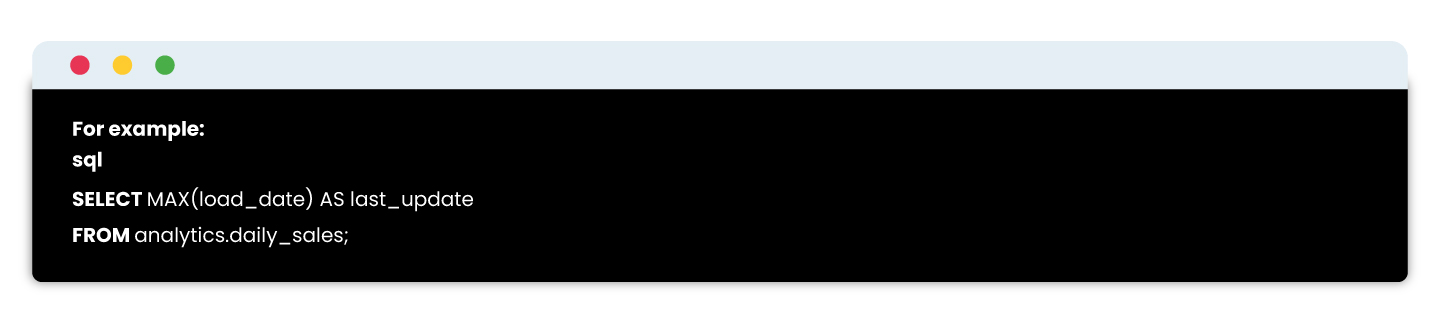 Verify that your critical tables update as expected daily with timestamp comparisons.
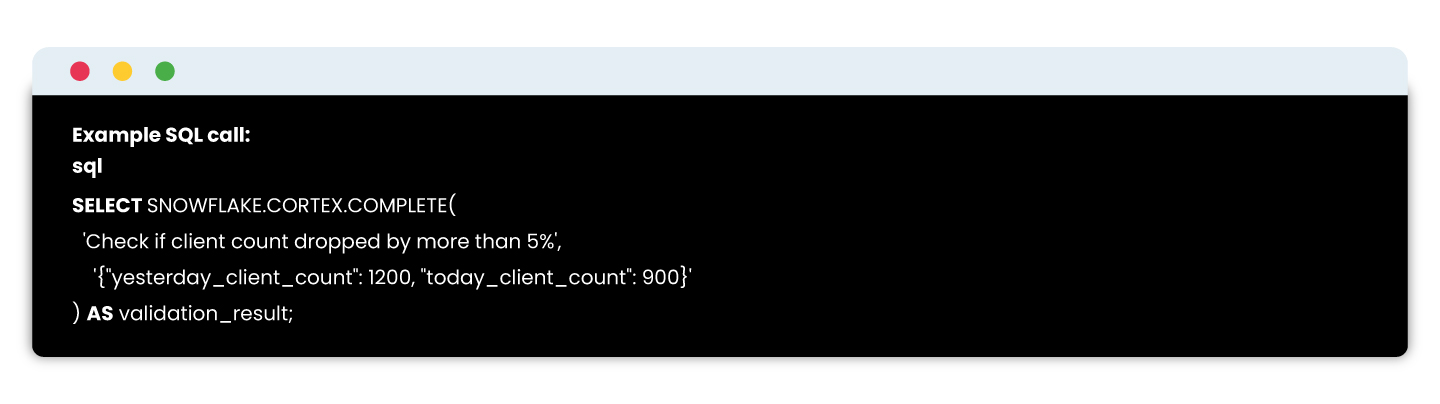 Snowflake Cortex enables embedding LLMs directly in SQL to evaluate complex data conditions naturally and intelligently.