


Summary
Parquet file format v2 is now generally available for Delta Lake and Apache Iceberg tables in Azure Databricks Runtime 18.1 and above. It swaps in smarter encodings, richer page-level metadata, and INT64 timestamps to shrink file sizes and speed up querieswith zero changes to your existing SQL. Turn it on with a single table property and use REORG TABLE when you want your historical data rewritten too.
Introduction
Global data volumes are on pace to cross roughly 230–240 zettabytes by 2026, according to Statista estimates, and every terabyte of that sits somewhere, on someone’s storage bill. Most of it, if you’re running an Azure Databricks lakehouse, sits in Parquet file format files. So when the format underneath your Delta Lake or Apache Iceberg tables gets a meaningful upgrade, it’s worth fifteen minutes of your attention.
That upgrade is Parquet v2, and unlike a major platform migration, it doesn’t ask you to touch a single line of application code or rewrite a query. It changes how data is physically packed inside the files themselves which, in practice, means smaller files, better compression, and faster reads for the same data you already have.
A quick note on terms, if you’re newer to the stack: Apache Parquet is the columnar file format that stores data by column rather than by row, letting a query engine like Spark read only the columns a query actually needs. Delta Lake is the transactional layer Databricks builds on top of Parquet it adds ACID guarantees, schema enforcement, and time travel. Apache Iceberg is a similar open table format, increasingly used alongside or instead of Delta Lake in mixed-engine environments. Parquet v2 sits one level below both of them, at the file format itself, which is exactly why it works across both table types without any application-level rework.
In this Parquet v2 Azure Databricks guide, we’ll cover what Parquet v2 actually changes compared to Parquet v1, how to turn it on, what to check before you do, and where it fits in a broader Databricks storage optimization strategy.
What Is Parquet v2?
Parquet file formathas been the default columnar storage format for big data platforms for well over a decade, and for good reason, it stores data efficiently and let’s query engines skip columns a query doesn’t touch. In wide tables, that column-pruning alone can cut I/O dramatically; reading two columns out of a hundred means the engine never has to touch the other ninety-eight.
But the original Parquet file formatspec (v1) was designed for a different era of data volumes, and three limitations became increasingly visible as workloads scaled:
- Integer and string compression left performance on the table.
- Query engines had limited page-level metadata to use for skipping unnecessary data.
- Timestamps relied on the older INT96 format, which compressed and filtered poorly.
Parquet v2 addresses all three with more efficient encodings, richer page metadata, and a modern INT64 timestamp format. According to Microsoft’s Azure Databricks documentation and Databricks’ own platform release notes, Parquet v2 is generally available for Delta Lake and Apache Iceberg tables starting in Databricks Runtime 18.1, with support for converting existing data added in Runtime 18.2.
Parquet v1 vs. Parquet v2, at a Glance
| Capability | Parquet v1 | Parquet v2 |
| Timestamp storage | INT96 | INT64 (better compression, more accurate stats) |
| Integer / string encoding | Standard RLE / dictionary | Adds DELTA_BINARY_PACKED and DELTA_LENGTH_BYTE_ARRAY for tighter packing |
| Page metadata | Basic headers | Richer v2 data page headers with per-page stats |
| Predicate pushdown | Limited page-level skipping | Finer-grained data skipping at the page level |
| Enable via | Default | delta.parquet.format.version / iceberg.parquet.format.version = 2.12.0 |
| Reader compatibility | Universal | Broad, but verify external / third-party readers |
What’s New in Parquet v2?
1. Better Compression for Integers and Strings
The headline change is how numeric and string values get stored. Parquet v2 introduces more efficient encoding techniques, including delta-based packing for integers and byte arrays, per the Apache Parquet specification, which typically produce:
- Smaller Parquet files
- Better compression ratios
- Faster decoding during query execution
Independent benchmarking from the DuckDB engineering team gives a useful sense of scale here: enabling Parquet v2’s newer encodings produced files roughly 30% smaller with 15% faster writes under Snappy compression, and about 11% smaller with 24% faster writes under zstd, across their test datasets. On highly sequential data, think auto-incrementing IDs or evenly spaced timestamps, the gains were far more dramatic, with some columns shrinking by over 90%.
One honest caveat worth flagging: delta encoding isn’t a universal win. On columns with moderate entropydata that repeats in patterns but isn’t cleanly sequential, delta encoding can occasionally produce larger files than v1, because it turns repeating values into effectively random deltas that compress worse. It’s a good reason to test against a representative sample of your own tables rather than assuming uniform gains.
2. Improved Data Page Headers
Parquet files are divided into pages, and in Parquet v2, each page carries richer metadata, allowing Databricks to determine whether a page contains relevant data before it’s ever read. That directly improves:
- Predicate pushdown
- Data skipping
- Query performance on filtered datasets
If your query filters sales data for a single month, Databricks can skip the pages that don’t contain data from that period, cutting the volume of data scanned, and the compute cost that comes with it.
3. INT64 Timestamps Instead of INT96
Older Parquet files stored timestamps in the INT96 format. Parquet v2 replaces it with the more efficient INT64 timestamp format, which brings:
- Better compression
- More accurate statistics
- Faster filtering on timestamp columns
- Better compatibility with modern analytics engines
Since most enterprise data warehouse tables lean heavily on timestamp columns event logs, transaction records, IoT telemetry this single change tends to have an outsized, noticeable impact on real-world query performance.
How to Enable Parquet v2
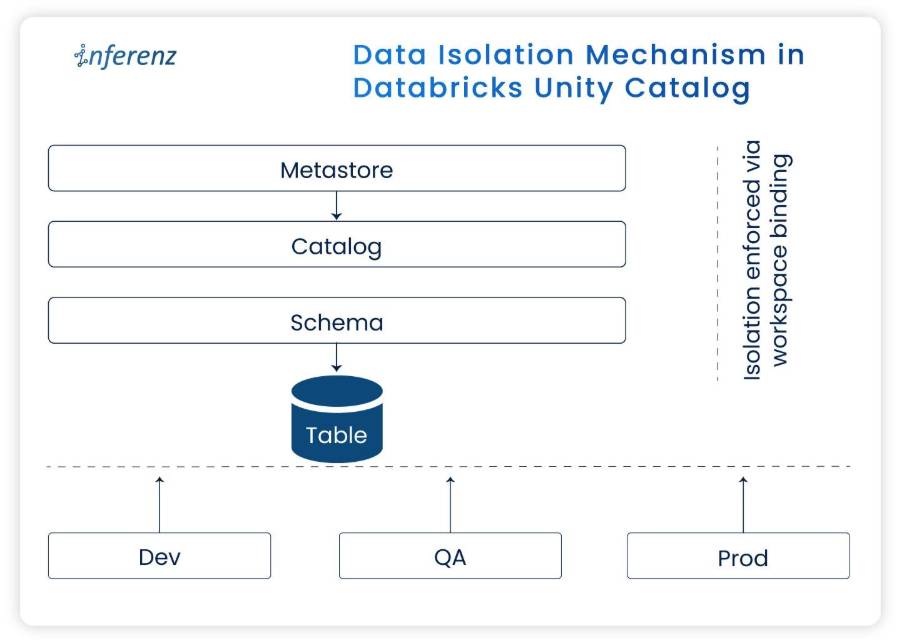
If you’re using Databricks Unity Catalog managed tables, Azure Databricks may automatically upgrade compatible tables to Parquet v2 for you. To enable it manually, set the table property directly.
Existing Delta table
 ALTER TABLE table_name
 SET TBLPROPERTIES (
 'delta.parquet.format.version' = '2.12.0'
 );
Existing Iceberg table
 ALTER TABLE table_name
 SET TBLPROPERTIES (
 'iceberg.parquet.format.version' = '2.12.0'
 );
New Delta table
 CREATE TABLE table_name (...)
 TBLPROPERTIES (
 'delta.parquet.format.version' = '2.12.0'
 );
New Iceberg table
 CREATE TABLE table_name (...)
 USING iceberg
 TBLPROPERTIES (
 'iceberg.parquet.format.version' = '2.12.0'
 );
Existing Data Isn’t Automatically Converted
This is the detail most teams miss on their first pass.
Changing the table property only affects new data written after the change. Your existing Parquet files stay in their original format, which means a single table can temporarily hold a mix of Parquet v1 and Parquet v2 files side by side.
If you want your historical data converted too, Databricks Runtime 18.2 and above provides the REORG TABLE command:
 REORG TABLE table_name
 APPLY (
 SET PARQUET (FORMAT_VERSION = '2.12.0')
 );
This rewrites every existing file using Parquet v2, so the entire table benefits from the format change.
Can You Roll Back?
Yes. If you hit a compatibility issue downstream, you can convert the table back to Parquet v1 just as easily:
 REORG TABLE table_name
 APPLY (
 SET PARQUET (FORMAT_VERSION = '1.0.0')
 );
This rewrites the data files again and restores the table to the older format a genuinely low-risk way to test Parquet v2 in a non-production environment before committing.
Things to Check Before Enabling Parquet v2
Parquet v2 delivers real gains, but it’s worth verifying compatibility if your data is read outside Databricks. Before flipping the switch, check for:
- External Apache Iceberg readers that may not yet support Parquet v2. DuckDB’s own engineering team, for instance, has noted that several mainstream query engines still default to writing (and in some cases reading) older Parquet encodings for exactly this reason.
- Delta Sharing or other external sharing methods confirm recipient tools can actually read Parquet v2 files before you share.
- Materialized views and streaming tables, which aren’t upgraded automatically and need to be enabled manually.
If your tables are read exclusively from within Databricks, compatibility generally isn’t a concern at all.
Should You Use Parquet v2?
For most Azure Databricks workloads, yes. Parquet v2 offers real advantages without requiring any application-side changes:
- Reduced storage usage
- Better compression
- Faster query execution
- Improved predicate pushdown
- Better timestamp handling
If your data is read exclusively within Azure Databricks, enabling Parquet v2 is a low-effort, high-leverage way to improve performance. If external tools, BI platforms, or third-party engines also touch your data, verify compatibility first.
A practical rollout sequence looks like this:
- Let Databricks Unity Catalog managed tables upgrade automatically where applicable.
- Enable Parquet v2 on Databricks-only tables first.
- Run REORG TABLE if you want existing data converted.
- Test external readers before enabling Parquet v2 on shared datasets.
Final Thoughts
Parquet v2 is the kind of improvement that works quietly in the background. You keep writing the same SQL, running the same pipelines, using the same BI tools but your data becomes more storage-efficient, and your queries, more often than not, come back a little faster.
For enterprises running Azure Databricks at scale, this is a low-effort upgrade with a real payoff, provided you verify compatibility for anyone reading your data outside the platform. As a Databricks consulting partner, Inferenz has helped enterprise data teams evaluate exactly this kind of platform-level change as part of broader Delta Lake and lakehouse cost-optimization engagements. Through its data engineering and integration services, organizations have optimized storage architectures, improved data performance, and reduced cloud infrastructure costs, where a one-line table property, applied correctly across the right tables, adds up to a measurable line item on the cloud bill.

Frequently Asked Questions
What is Parquet v2 in Azure Databricks?
Parquet v2 is an updated version of the Apache Parquet file format, generally available for Delta Lake and Apache Iceberg tables in Databricks Runtime 18.1 and later. It uses more efficient encodings, richer page-level metadata, and INT64 timestamps to reduce file size and improve query performance, without requiring any changes to existing SQL or application code.
Is Parquet v2 backward compatible with Parquet v1?
Yes, in the sense that a table can hold both v1 and v2 files simultaneously, and readers built to handle the v2 spec can typically process both. However, some external tools and older Parquet readers outside the Databricks ecosystem may not yet support the newer v2 encodings, so it’s worth verifying compatibility for any downstream consumers.
Does enabling Parquet v2 automatically rewrite my existing data?
No. Setting the delta.parquet.format.version or iceberg.parquet.format.version property only affects new files written after the change. To convert historical data, run the REORG TABLE … APPLY (SET PARQUET (FORMAT_VERSION = ‘2.12.0’)) command, available in Databricks Runtime 18.2 and above.
Which Databricks Runtime version supports Parquet v2?
Parquet v2 is generally available for Delta Lake and Apache Iceberg tables starting in Databricks Runtime 18.1. The REORG TABLE command for converting existing data to Parquet v2 requires Databricks Runtime 18.2 or later.
Will Parquet v2 break compatibility with my BI tools or external Iceberg readers?
It can, if those tools rely on older Parquet readers that haven’t yet implemented support for v2 encodings. Before enabling Parquet v2 on tables shared via Delta Sharing or read by external engines, test those specific readers first. Tables read exclusively within Databricks generally have no compatibility concerns.
Can I convert a Parquet v2 table back to Parquet v1?
Yes. Running REORG TABLE table_name APPLY (SET PARQUET (FORMAT_VERSION = ‘1.0.0’)) rewrites the table’s data files and restores it to the Parquet v1 format, making it straightforward to test v2 and roll back if you hit a compatibility issue.


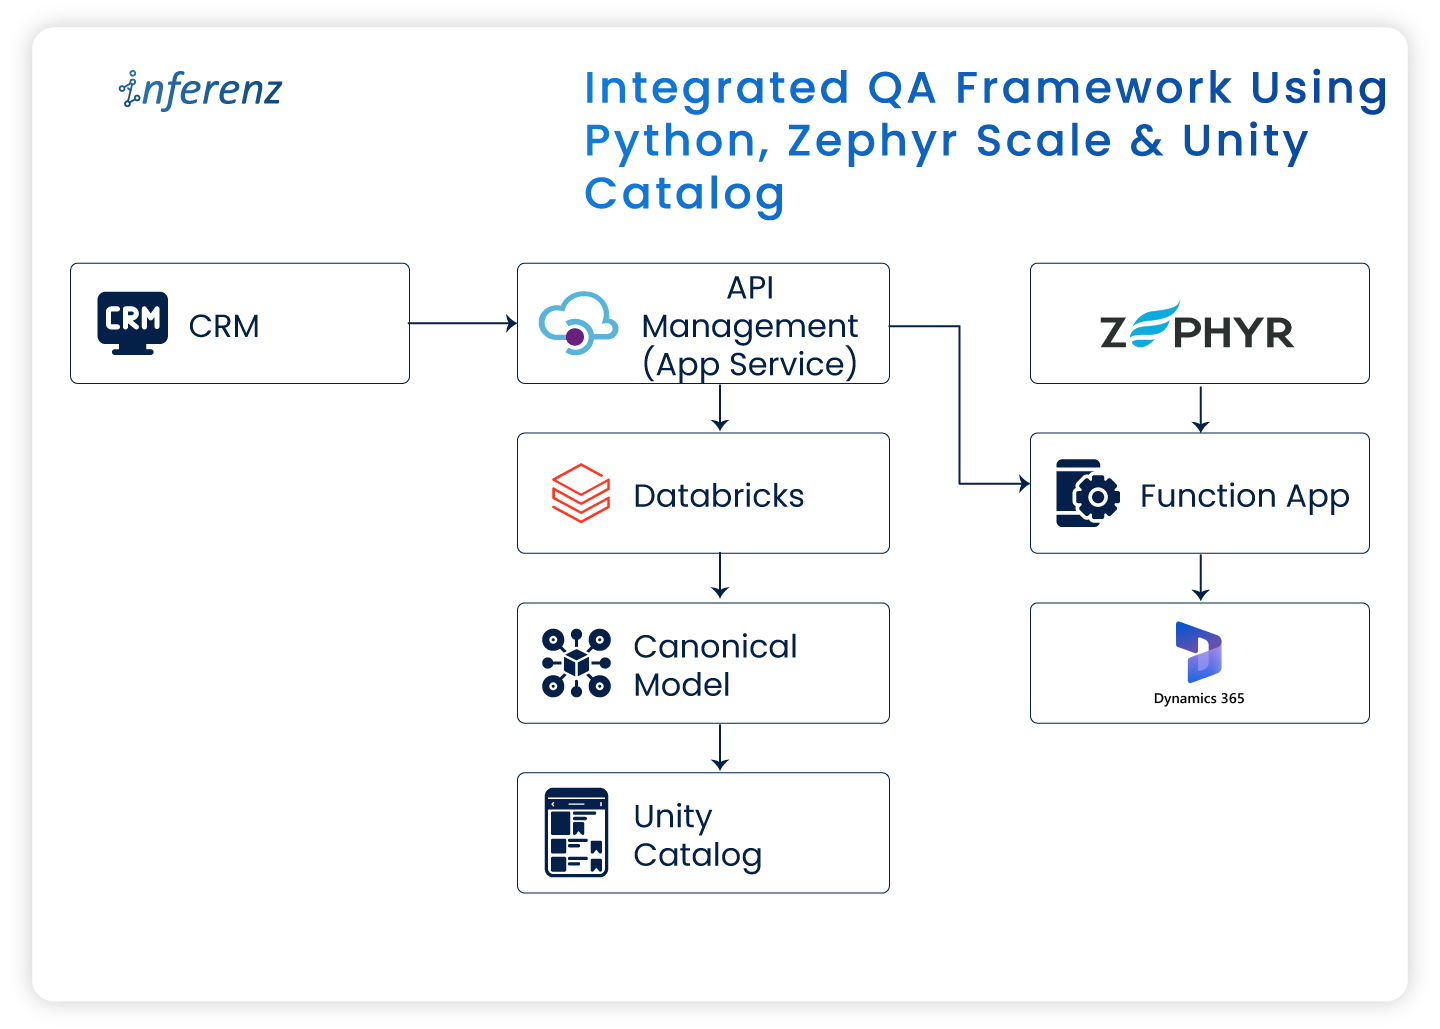 Integrated QA framework using Python, Zephyr Scale & Unity Catalog


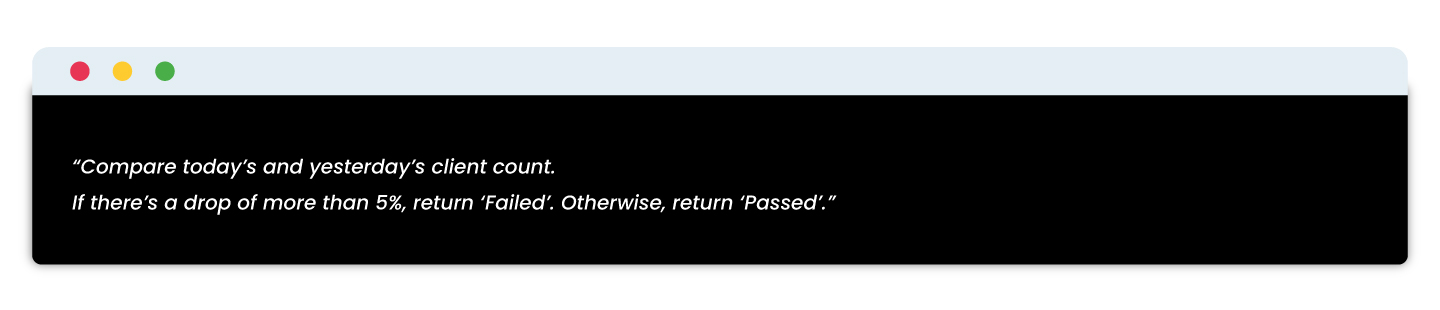
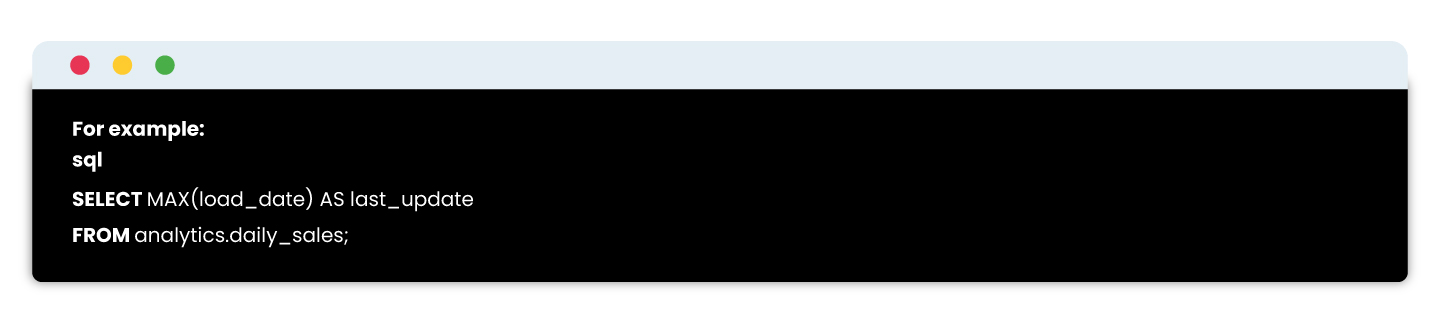 Verify that your critical tables update as expected daily with timestamp comparisons.
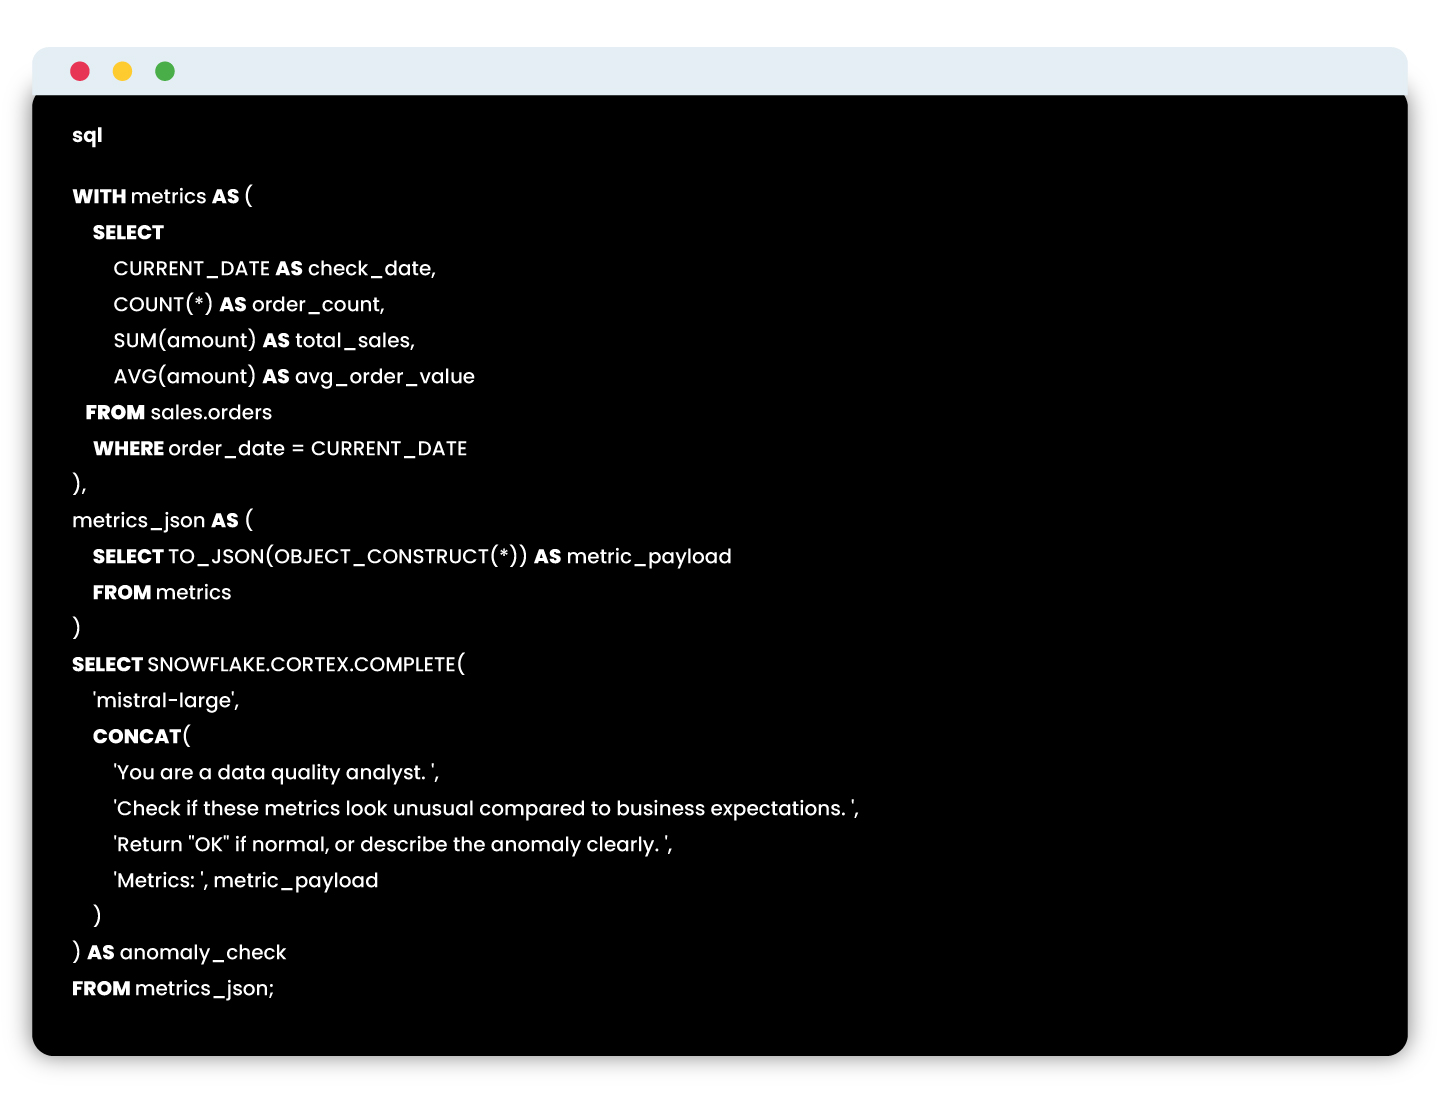
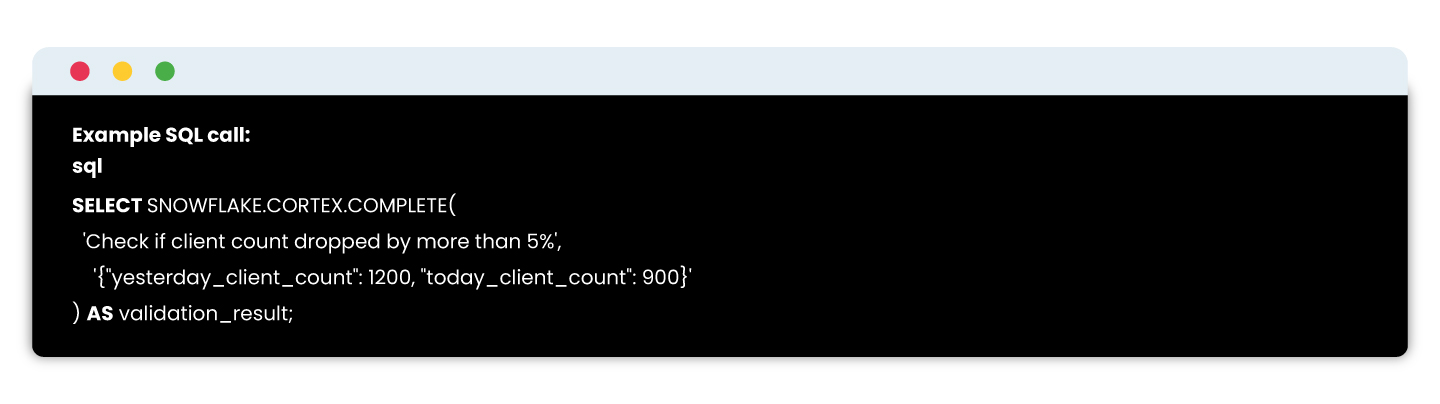 Snowflake Cortex enables embedding LLMs directly in SQL to evaluate complex data conditions naturally and intelligently.