


Background Summary
Model drift is more than a real data science headache, it’s a silent business killer. When the data your AI relies on changes, predictions falter, decisions suffer, and trust erodes. This guide explains what drift is, why it affects every industry, and how a mix of smart monitoring, robust data pipelines, and AI-powered cleaning tools can keep your models performing at their peak.-Imagine launching a new product, rolling out a service upgrade, or opening a flagship store after months of preparation, only to find customer complaints piling up because something invisible changed behind the scenes. In AI, that invisible culprit is often model drift.
Your model worked perfectly in testing. Predictions were accurate, dashboards lit up with promising KPIs. But months later, results dip, costs climb, and customer trust erodes. What changed?
The data feeding your model no longer reflects the real world it serves.
This article breaks down why that happens, why it matters to every industry, and how modern tools can stop drift before it damages outcomes.
What is “Data Drama”?
“Data drama” means wrestling with disorganized, inconsistent, or incomplete data when building AI solutions, leading to model drift. Model drift refers to the degradation of a model’s performance over time due to changes in data distribution or the environment it operates in.
Think of it as junk in the trunk: if your AI is the car, bad data makes for a bumpy ride, no matter how powerful the engine is.
Picture a hospital that wants to use AI to predict patient health risks:
- Patient names are sometimes written “Jon Smith,” “John Smith,” or “J. Smith.”
- Some records are missing phone numbers or have outdated addresses.
- The hospital’s old records are stored in paper files or weird formats.
Even if the AI is “smart,” it struggles to learn from such confusing information. There are three primary types of drifts that affect the scenarios:
- Data drift (covariate shift): The input distribution P(x) changes. Example: new user behavior, seasonal trends, new data sources.
- Concept drift: The relationship between features and target P(y∣x) changes. Example: fraud tactics evolve customer churn reasons shift.
Label drift (prior probability shift): The distribution of P(y) changes. Common in imbalanced classification tasks.
Why is this a problem?
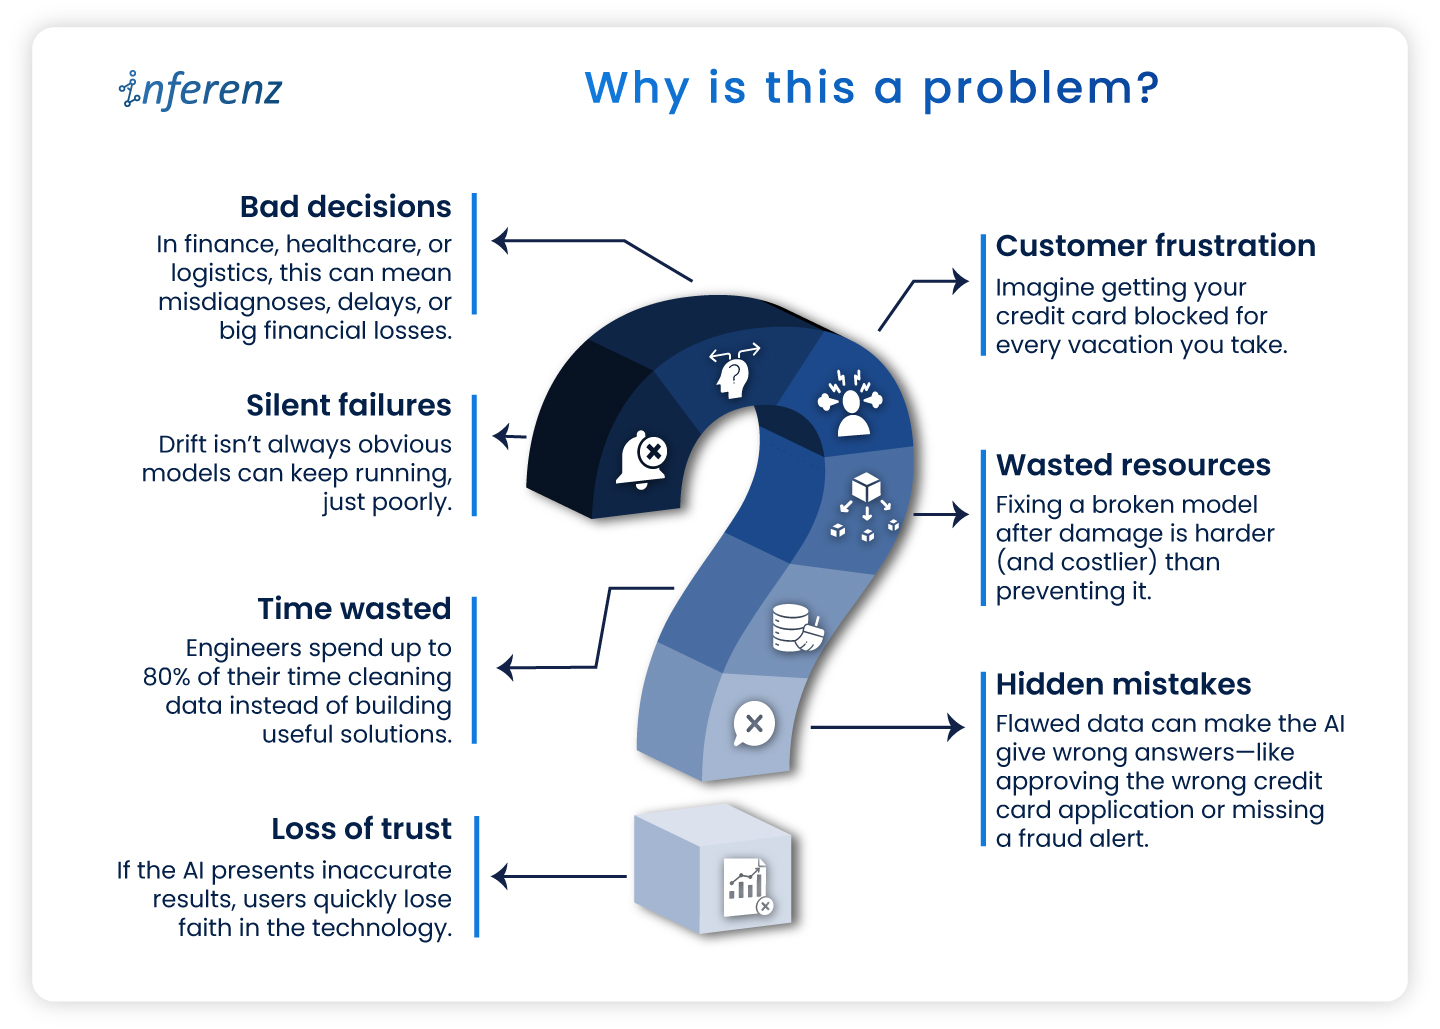
- Silent failures: Drift isn’t always obvious models can keep running, just poorly.
- Bad decisions: In finance, healthcare, or logistics, this can mean misdiagnoses, delays, or big financial losses.
- Customer frustration: Imagine getting your credit card blocked for every vacation you take.
- Wasted resources: Fixing a broken model after damage is harder (and costlier) than preventing it.
- Time wasted: Engineers spend up to 80% of their time cleaning data instead of building useful solutions.
- Hidden mistakes: Flawed data can make the AI give wrong answers—like approving the wrong credit card application or missing a fraud alert.
- Loss of trust: If the AI presents inaccurate results, users quickly lose faith in the technology.
Why is it hard to catch?
- Most production pipelines don’t monitor live feature distributions or prediction confidence.
- Business KPIs may degrade before engineers notice any statistical performance drop.
- Retraining isn’t always feasible daily, especially without label feedback loops.
How can we solve the data drama?
Today, AI itself helps clean and fix messy data, making life easier for both techies and non-techies. Here’s a step-by-step technical approach for managing drift in production systems:
1. Track key statistical metrics on input data:
-
-
- Population stability index (PSI)
- Kullback-leibler divergence (KL Divergence)
- Kolmogorov-smirnov (KS) test
- Wasserstein distance (for continuous features)
-
Implementation example:
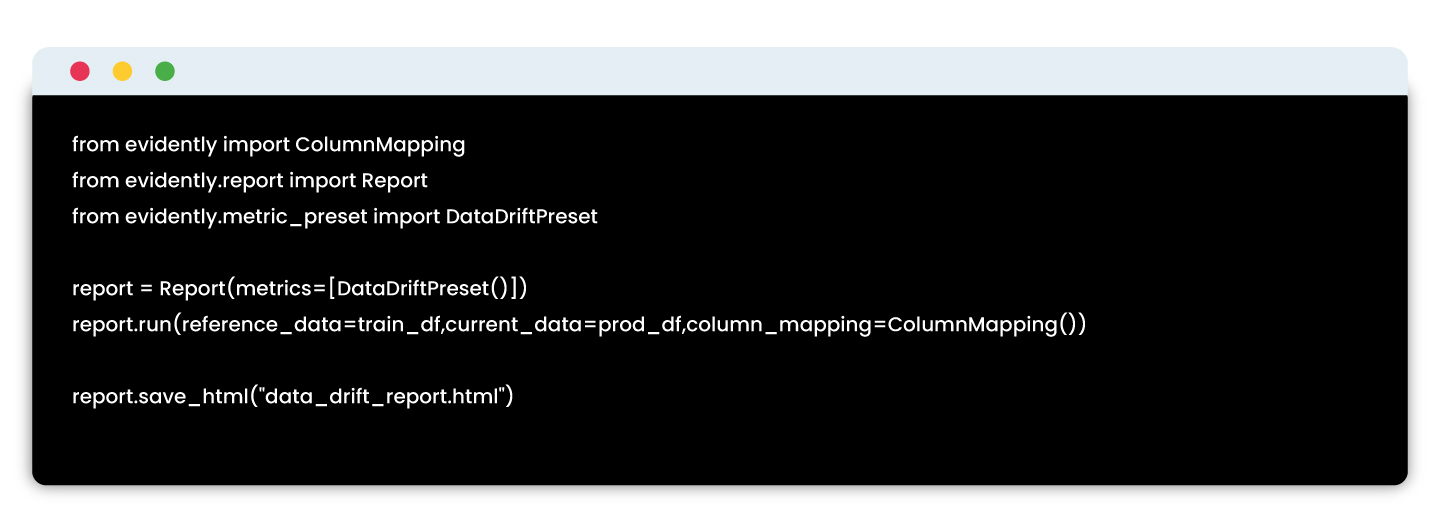
Tools: Evidently AI, WhyLabs, Arize AI
2. Monitoring model performance without labels
If you can’t get real-time labels, use proxy indicators:
-
-
- Confidence score distributions (are they shifting?)
- Prediction entropy or uncertainty variance
- Output class distribution shift
-
Example using fiddler AI:
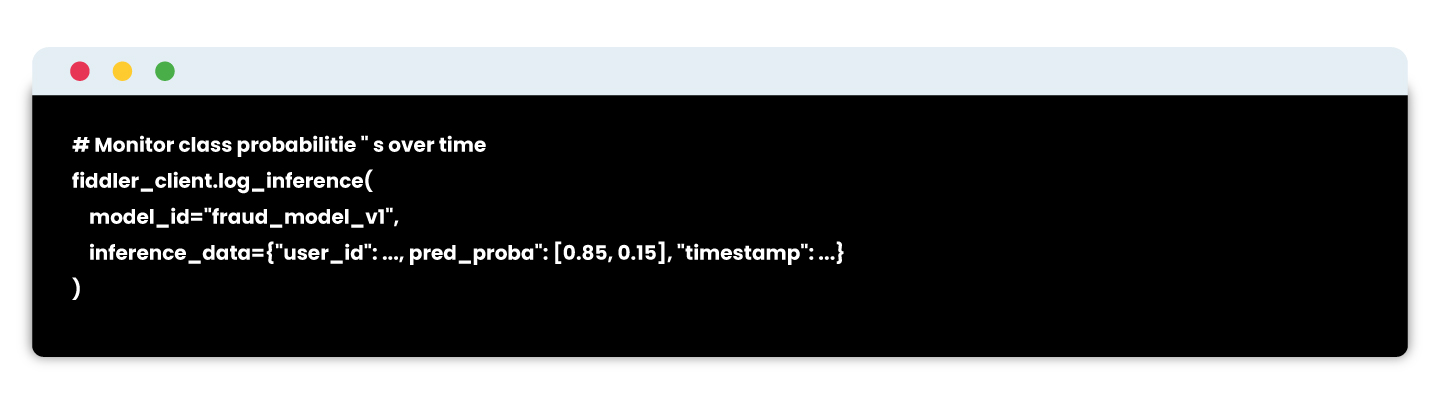
# Detect divergence from training output distributions
3. Retraining pipelines & model registry integration
Build retraining workflows that:
-
-
- Pull recent production data
- Recompute features
- Revalidate on held-out test sets
- Re-register the model with metadata
-
Example stack:
-
-
- Feature store: Feast / Tecton
- Training pipelines: MLflow / SageMaker Pipelines / Vertex AI
- CI/CD: GitHub Actions + DVC
-
Registry: MLflow or SageMaker Model Registry

Tools & solutions
This is broken down by stages of the solution pipeline:
1.Understanding what data is missing
Before solving the problem, you need to identify what is missing or irrelevant in your dataset.
| Tool | Purpose | Features |
| Great expectations | Data profiling, testing, validation | Detects missing values, schema mismatches, unexpected distributions |
| Pandas profiling / YData profiling | Exploratory data analysis | Generates auto-EDA reports; useful to check data completeness |
| Data contracts (openLineage, dataplex) | Define expected data schema and sources | Ensures the data you need is being collected consistently |
2. Data collection & logging infrastructure
To fix missing data, you need to collect more meaningful, raw, or contextual signals—especially behavioral or operational data.
| Tool | Use Case | Integration |
| Apache kafka | Real-time event logging | Captures user behavior, app events, support logs |
| Snowplow analytics | User tracking infrastructure | Web/mobile event tracking pipeline for custom behaviors |
| Segment | Customer data platform | Collects customer touchpoints and routes to data warehouses |
| OpenTelemetry | Observability for services | Track service logs, latency, API calls tied to user sessions |
| Fluentd / Logstash | Log collectors | Integrate service and system logs into pipelines for ML use |
3. Feature engineering & enrichment
Once the relevant data is collected, you’ll need to transform it into usable features—especially across systems.
| Tool | Use Case | Notes |
| Feast | Open-source feature store | Manages real-time and offline features, auto-syncs with models |
| Tecton | Enterprise-grade feature platform | Centralized feature pipelines, freshness tracking, time-travel |
| Databricks feature store | Native with Delta Lake | Integrates with MLflow, auto-tracks lineage |
| DBT + Snowflake | Feature pipelines via SQL | Great for tabular/business data pipelines |
| Google vertex AI feature store | Fully managed | Ideal for GCP users with built-in monitoring |
4. External & third-party data integration
Some of the most relevant data may come from external APIs or third-party sources, especially in domains like finance, health, logistics, and retail.
| Data type | Tools / APIs |
| Weather, location | OpenWeatherMap, HERE Maps, NOAA APIs |
| Financial scores | Experian, Equifax APIs |
| News/sentiment | GDELT, Google Trends, LexisNexis |
| Support tickets | Zendesk API, Intercom API |
| Social/feedback | Trustpilot API, Twitter API, App Store reviews |
5. Data observability & monitoring
Once new data is flowing, ensure its quality, freshness, and availability remain intact.
| Tool | Capabilities |
| Evidently AI | Data drift, feature distribution, missing value alerts |
| WhyLabs | Real-time observability for structured + unstructured data |
| Monte Carlo | Data lineage, freshness monitoring across pipelines |
| Soda.io | Data quality monitoring with alerts and testing |
| Datafold | Data diffing and schema change tracking |
6. Explainability & impact analysis
You want to make sure your added features are actually helping the model and understand their impact.
| Tool | Use Case |
| SHAP / LIME | Explain model decisions feature-wise |
| Fiddler AI | Combines drift detection + explainability |
| Arize AI | Real-time monitoring and root-cause drift analysis |
| Captum (for PyTorch) | Deep learning explainability library |
Why model drift is every business’s problem
Model drift may sound like a technical glitch, but its consequences ripple across industries in ways that hurt revenue, efficiency, and trust.
- Healthcare – A drifted model can misread patient risk levels, causing missed diagnoses, delayed interventions, or unnecessary tests. In critical care, this can directly affect patient outcomes.
- Finance – Inconsistent data patterns can produce incorrect credit scoring or flag legitimate transactions as fraudulent, frustrating customers and damaging loyalty.
- Retail & E-commerce – Changing buying behavior or seasonal demand shifts can lead to inaccurate demand forecasts, resulting in overstock that ties up cash or stockouts that push customers to competitors.
- Manufacturing & supply chain – Predictive maintenance models can miss early signs of equipment wear, leading to unplanned downtime that halts production lines.
The common thread?
- Revenue impact – Poor predictions lead to lost sales opportunities and operational waste.
- Compliance risk – In regulated sectors, drift can create breaches in reporting accuracy or fairness obligations.
Brand reputation – Customers and partners lose trust if decisions feel inconsistent or incorrect.

The cost of ignoring model drift
The business case for tackling drift is backed by hard numbers:
- Data quality issues cost organizations an average of $12.9 million annually.
- For predictive systems, downtime can cost $125,000 per hour on an average depending on the industry.
- Recovery from a drifted model, retraining, redeployment, and regaining lost customer trust, can take weeks to months, costing far more than prevention.
Implementing automated drift detection can reduce model troubleshooting time drastically. Early intervention can prevent revenue losses in industries where decisions are AI-driven.
In other words, the cost of not acting is often several times higher than the cost of building proactive safeguards.
From detection to prevention
Drift management is about more than catching problems, it’s about designing systems that keep models healthy and relevant from the start.
| Approach | What It Looks Like | Outcome |
| Reactive | Model performance dips → business KPIs drop → engineers scramble to investigate. | Higher downtime, lost revenue, longer recovery cycles. |
| Proactive | Continuous monitoring of data and predictions → alerts trigger retraining before business impact. | Minimal disruption, sustained model accuracy, preserved customer trust. |
Why proactive wins:
- Reduces firefighting and emergency fixes.
- Ensures AI systems adapt alongside market or operational changes.
- Turns drift management into a competitive advantage, keeping predictions accurate while competitors struggle with outdated models.
Takeaway
In fast-moving markets, your AI is only as good as the data it learns from. Drift happens quietly, but its effects ripple loudly across customer experiences, operational efficiency, and revenue. By combining continuous monitoring with adaptive retraining, businesses can turn model drift from a costly disruption into a controlled, measurable process.
The real win is beyond the fact that it fixes broken predictions. Now you can build AI systems that grow alongside your business, staying relevant and reliable in any market condition.