


Summary
Data warehouse design decides how fast your teams get answers, how much they trust the numbers, and how easily you can scale analytics and AI. This guide breaks down architecture approaches, schema options, and implementation patterns, with clear “use when” guidance for each.
Introduction: Understanding Data Warehouse Designs
In today’s data-driven world, organizations rely on data warehouses to consolidate, organize, and analyze massive volumes of information. But building a data warehouse is not just about storing data – it’s about designing it in a way that maximizes speed, accuracy, and business value.
A data warehouse design determines how data is structured, stored, and accessed. It affects everything from query performance to reporting accuracy, machine learning capabilities, and regulatory compliance.
Choosing the right design is crucial because a poorly designed warehouse can slow analytics, increase costs, and lead to incorrect business decisions.
Why Data Warehouse Design Matters
- Performance: Ensures queries run quickly, enabling real-time dashboards and faster decision-making.
- Scalability: Supports data growth without costly re-engineering.
- Data Quality & Governance: Reduces redundancy, ensures consistency, and provides audit traceability.
- Business Alignment: Reflects how the business measures success, making analytics intuitive for end-users.
The following designs apply to organizations that provide data in batches. Details on warehouse design for organizations that provide real-time data, will be covered separately.
Simple Data Warehouse Architecture Diagram (3-Layer View)
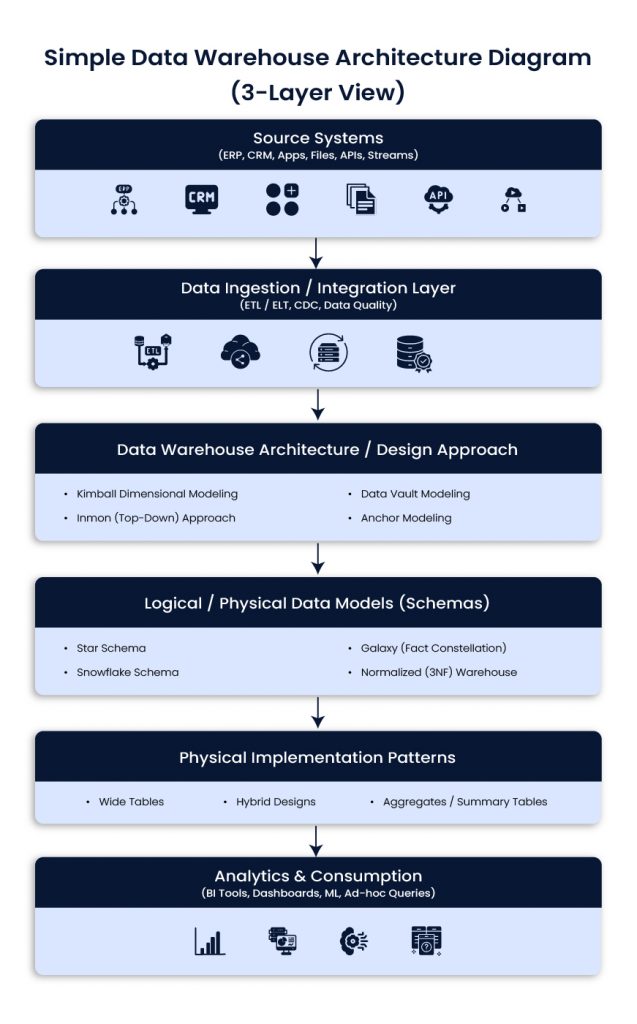
Source systems
ERP, CRM, product apps, files, APIs, event streams
Ingestion and integration
ETL or ELT, CDC, data quality checks, standardization
Warehouse and modeling layers
Architecture approach (Kimball, Inmon, Data Vault, Anchor)
Schema design (star, snowflake, galaxy, 3NF)
Implementation patterns (wide tables, aggregates, hybrid)
Consumption
BI tools, dashboards, ad-hoc queries, ML workflows
Data Warehouse Architecture / Design Approaches
Data warehouse architecture defines the overall strategy and methodology for building a data warehouse, guiding how data is collected, integrated, stored, and accessed for analysis. Unlike individual schema designs that focus on table structures, these approaches provide a high-level blueprint for enterprise data management and analytics.
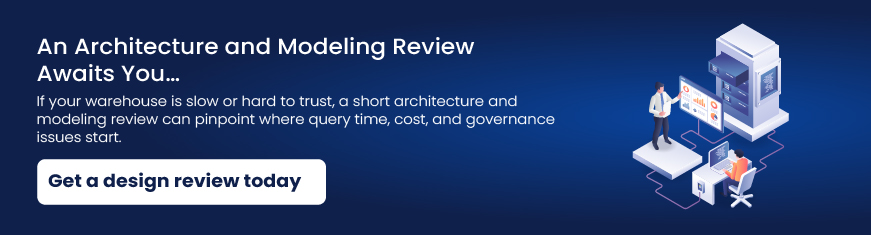
Kimball Dimensional Modeling
Kimball focuses on building dimensional models around business processes, often as data marts that roll up into a broader analytical layer. It is popular because it is easy to understand and fast for BI.
Use when
- Business users need intuitive reporting quickly
- Requirements are stable and well understood
- You want incremental delivery with visible wins
Best fit
- BI dashboards, finance and revenue reporting, sales and marketing analytics
Typical impact
- Faster time to value, strong user adoption, simpler reporting model
Example scenario
Marketing needs campaign performance dashboards quickly. Kimball supports focused data marts, conformed dimensions, and fast reporting delivery.
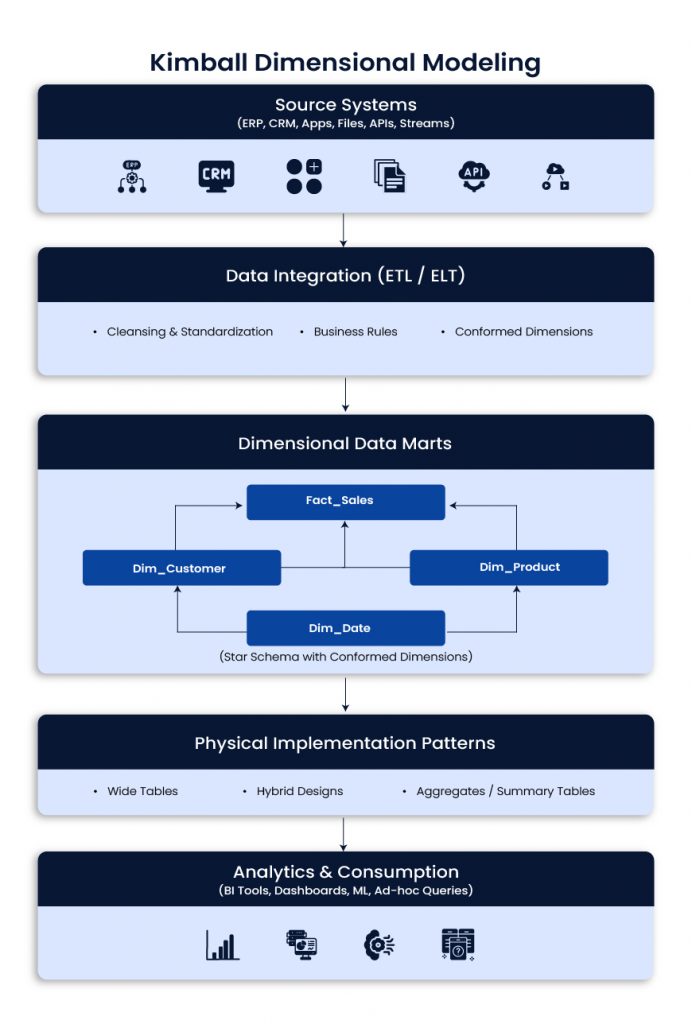
Inmon top-down approach (enterprise-first EDW)
Inmon starts with a centralized enterprise data warehouse, usually in normalized 3NF structures. Data marts are derived later for performance and ease of reporting. It takes longer to build but supports consistent enterprise definitions.
Use when
- A single version of truth is required across functions and regions
- Governance and standardization are priorities
- Integration across many systems is complex
Best fit
- Large enterprises with strict KPI consistency and governance needs
Typical impact
- Higher trust in metrics, stronger control, better enterprise alignment
Example scenario
A global company needs standardized KPIs across regions. Inmon supports centralized definitions and reduces conflicting reports.
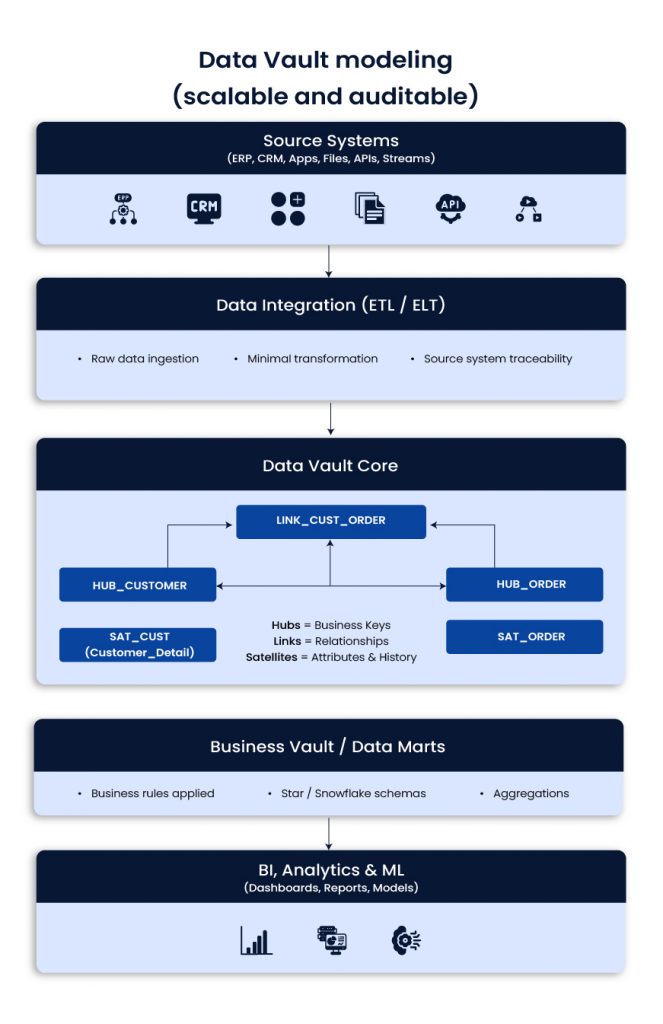
Data Vault modeling (scalable and auditable)
Data Vault organizes data into Hubs (business keys), Links (relationships), and Satellites (descriptive history). It separates raw ingestion from business logic, which helps with change, traceability, and long-term integration.
Use when
- Source systems change often
- Historical tracking and auditability matter
- You expect new domains and sources over time
Best fit
- Telecom, finance, insurance, regulated industries, complex enterprise integration
Typical impact
- Faster onboarding of sources, fewer breakages from schema drift, stronger lineage
Example scenario
A telecom adds new products and pricing models often. Data Vault reduces the blast radius of change and keeps history intact.
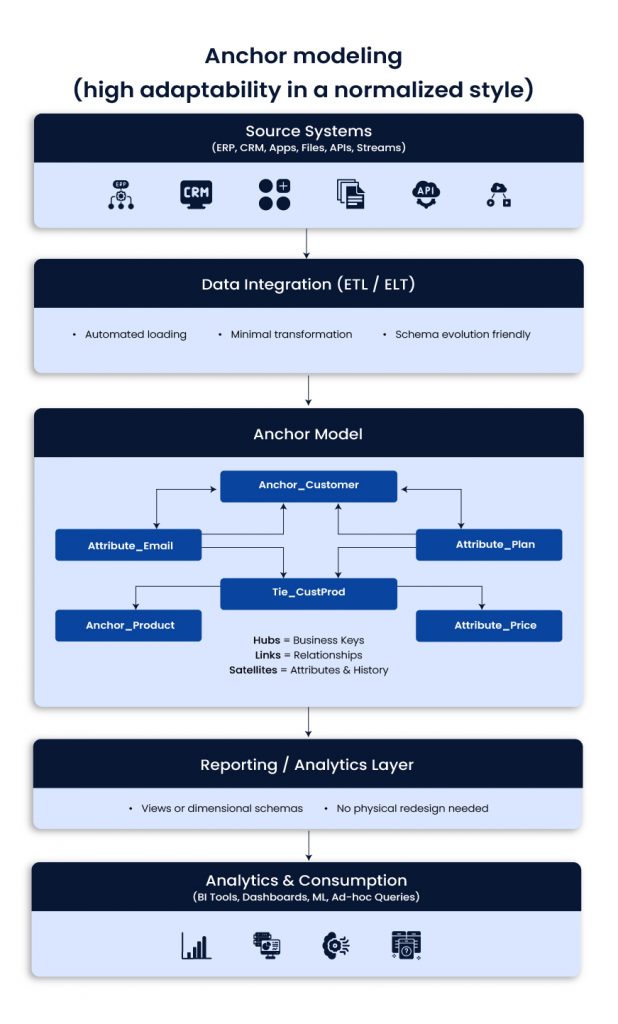
Anchor modeling (high adaptability in a normalized style)
Anchor modeling uses Anchors (core entities), Attributes, and Ties (relationships). It is designed for frequent change. You can add new attributes without redesigning large parts of the model.
Use when
- Business attributes and rules change frequently
- You need flexibility without major table redesign
- You want a long-lived model that evolves with the business
Best fit
- Fast-changing SaaS environments and evolving product analytics needs
Typical impact
- Less rework, easier schema evolution, better maintainability
Example scenario
A SaaS business keeps adding customer attributes. Anchor modeling supports this without downtime-heavy redesigns.
Schema designs: logical and physical models
Schemas define how tables are structured. They affect join patterns, usability, and performance.
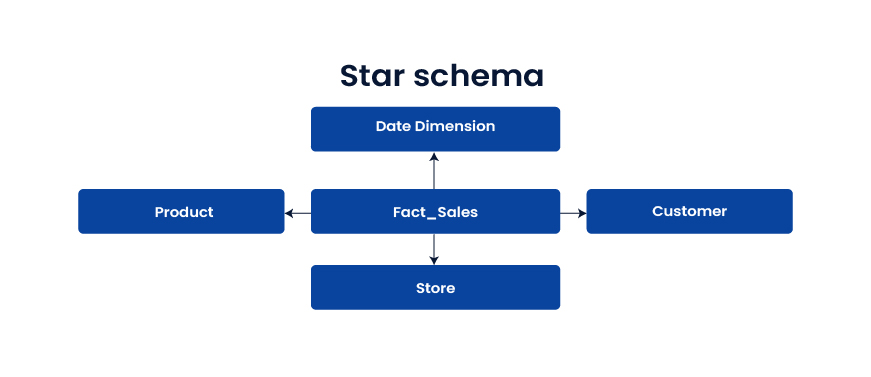
Star schema
The star schema is a central fact table that connects to denormalized dimensions. It is widely used because it is fast and easy to query.
Use when
- You want fast BI and simple reporting
- Many users run ad-hoc analysis
- Business teams need clear dimensions and metrics
Best fit
Dashboards, KPI reporting, analytics that depend on speed
Snowflake schema
Dimensions are normalized into sub-tables, often to manage hierarchies and reduce redundancy. It can save storage but adds joins.
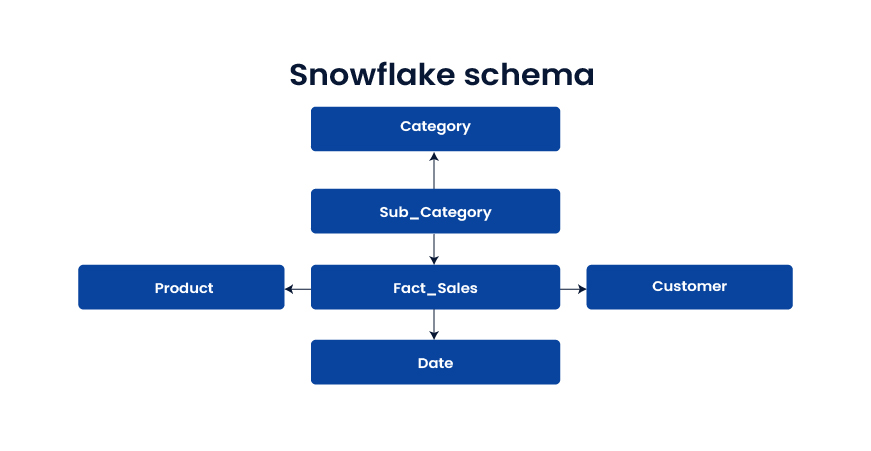
Use when
- Dimension hierarchies are complex
- Storage efficiency matters
- Slightly slower queries are acceptable
Best fit
Large product catalogs, structured hierarchies, domains with frequent hierarchy updates
Galaxy schema (fact constellation)
Multiple fact tables share dimension tables. It supports cross-process analytics across domains like orders, shipments, returns, and inventory.
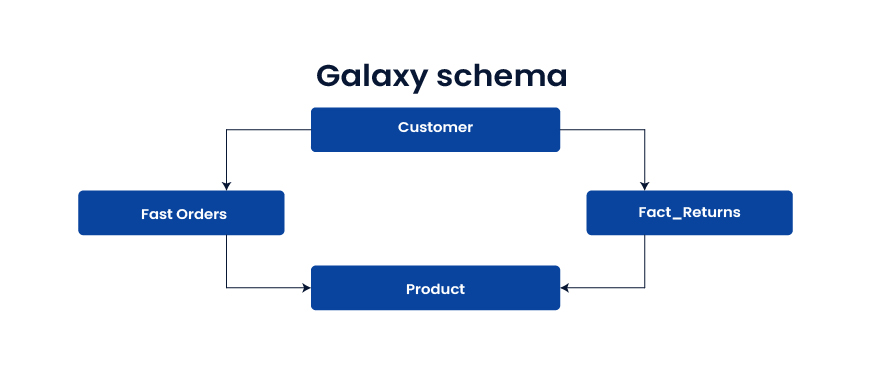
Use when
- You need analysis across multiple business processes
- Shared dimensions create enterprise views of the customer or product
Best fit
E-commerce, supply chain, end-to-end customer journey analytics
Normalized 3NF enterprise warehouse
Highly normalized tables reduce redundancy and enforce integrity. It is strong for integration and governance, but reporting queries can be slower without downstream marts.
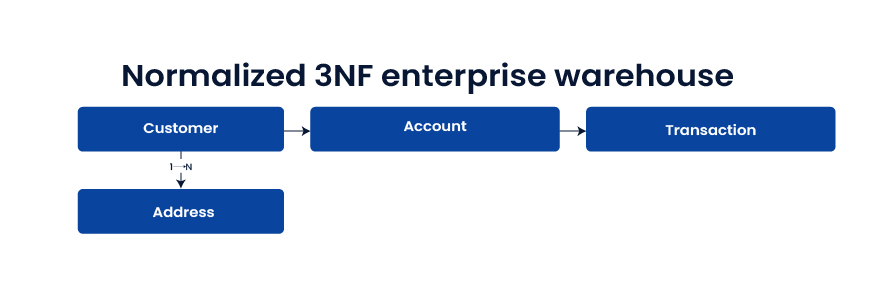
Use when
- The warehouse is a system of record
- Audit and regulatory demands are high
- Integration consistency matters more than reporting speed
Best fit
Enterprise integration layer, regulated domains, “one source of truth” requirements
Physical implementation patterns
These patterns influence performance and cost once architecture and schemas are chosen.
Wide tables
Wide tables store facts and useful attributes together in a denormalized structure. They reduce joins and speed up analytics and ML feature use.
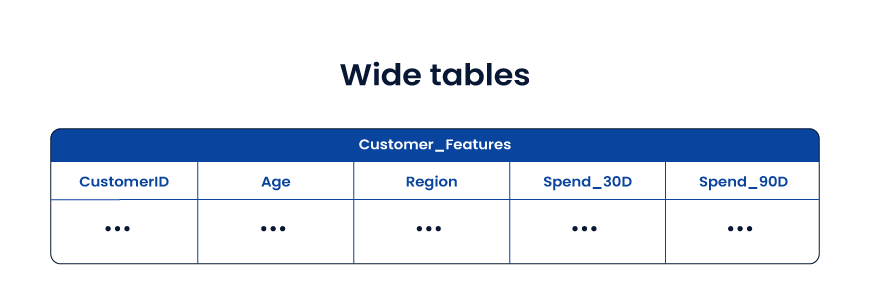
Use when
- ML feature pipelines suffer from join complexity
- Query speed is more important than storage
- Data models are stable enough for denormalization
Best fit
- AI feature stores, customer 360 analytics, experimentation analytics
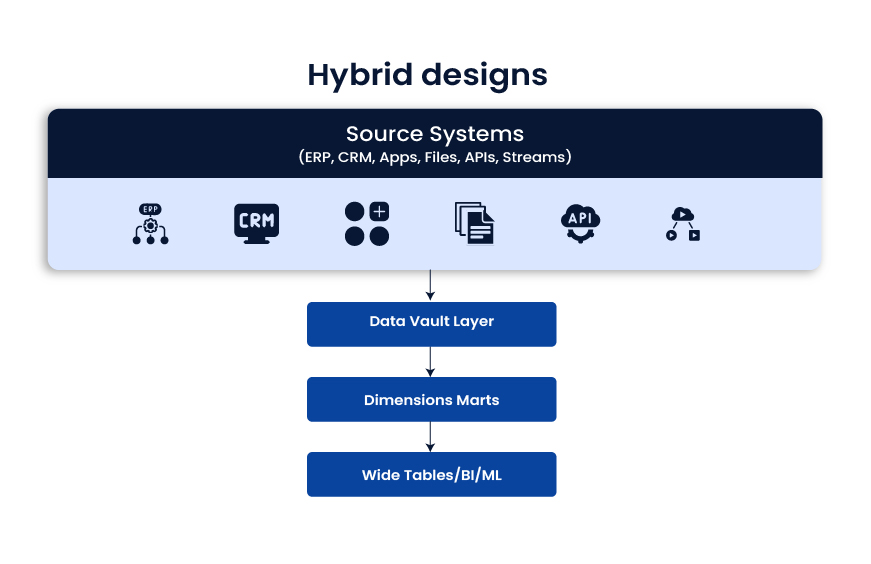
Hybrid designs
Hybrid designs mix approaches and optimize each layer for its job. A common pattern is: raw integration layer (often Data Vault), then dimensional marts for BI, then wide tables for ML and performance-heavy use cases.
Use when
- You support BI, advanced analytics, and ML together
- Workloads differ by team and tool
- You want both governance and speed
Best fit
- Modern enterprise data platforms where one model cannot satisfy every use case
Practical selection guide
- Fast reporting and quick wins: Kimball + star schema
- Enterprise consistency and governance: Inmon or 3NF EDW feeding marts
- Frequent source change and deep audit needs: Data Vault
- Rapidly evolving attributes and long-term flexibility: Anchor modeling
- Cross-domain process analytics: Galaxy schema
- Performance-heavy analytics and ML features: Wide tables
- Mixed workloads across BI and AI: Hybrid layered approach
Conclusion
The best data warehouse design is the one that fits your business reality, not the one that looks best on a whiteboard. Every architecture choice shapes what happens downstream: dashboard speed, reporting trust, integration effort, governance strength, and how ready your teams are for advanced analytics and AI.
For most U.S. enterprises, the smartest path is to separate concerns. Use a strong data warehouse architecture for integration and traceability, choose the right data warehouse schema design for reporting, and apply performance patterns like wide table design only where they make sense. In many environments, that naturally leads to a hybrid data warehouse architecture, where Data Vault modeling supports scalable ingestion, Kimball dimensional modeling powers BI adoption, and curated layers enable ML without breaking reporting.
Whether you choose the Inmon approach, a pure dimensional strategy, or a layered model, the goal stays the same: reduce friction between data teams and decision-makers. When the design is right, analytics becomes faster, costs become predictable, and the warehouse becomes a stable foundation for growth, modernization, and AI-driven outcomes.
Frequently Asked Questions
- How do I know if our data warehouse design is the reason dashboards are slow
If users complain about long load times, frequent timeouts, or “works for one report but not another,” design is a common root cause. Look for heavy join chains, inconsistent grains in fact tables, and unclear dimensional modeling.
- What’s the best data warehouse design for AI and machine learning in production?
Most teams succeed with a layered approach: governed integration, curated marts for metrics, and feature-friendly wide tables for training and inference. This structure keeps business reporting stable while supporting fast model iteration.
- Should we standardize on one modeling approach across the enterprise?
A single approach sounds tidy, but it often causes trade-offs. BI, operational reporting, and ML have different needs. Many CTOs choose a hybrid design so each layer stays fit for purpose without constant compromise.
- Kimball vs Inmon: which one fits a modern cloud data platform?
Kimball is often faster to deliver for analytics teams and business stakeholders. Inmon supports a centralized EDW with strong standardization. In cloud environments, many enterprises combine them, with enterprise integration feeding dimensional marts.
- What changes usually reduce cost without breaking performance?
The biggest wins often come from fixing data duplication, standardizing metric definitions, reducing unnecessary transforms, and tuning partitioning and clustering. You also get savings by separating workloads so BI queries do not compete with batch jobs or ML pipelines.