


Summary
OpenSearch is a flexible platform used for search, analytics, observability, and security across modern data environments. This article explains how it supports full-text search, log monitoring, threat detection, business analytics, and research use cases at scale.
Introduction
OpenSearch is an open-source, distributed search and analytics platform managed by AWS. It supports full-text search, real-time analytics, observability, and security monitoring at scale.
Across enterprise systems, cloud environments, and research settings, OpenSearch helps teams index, analyze, and act on large volumes of data with speed and flexibility.
OpenSearch at a Glance
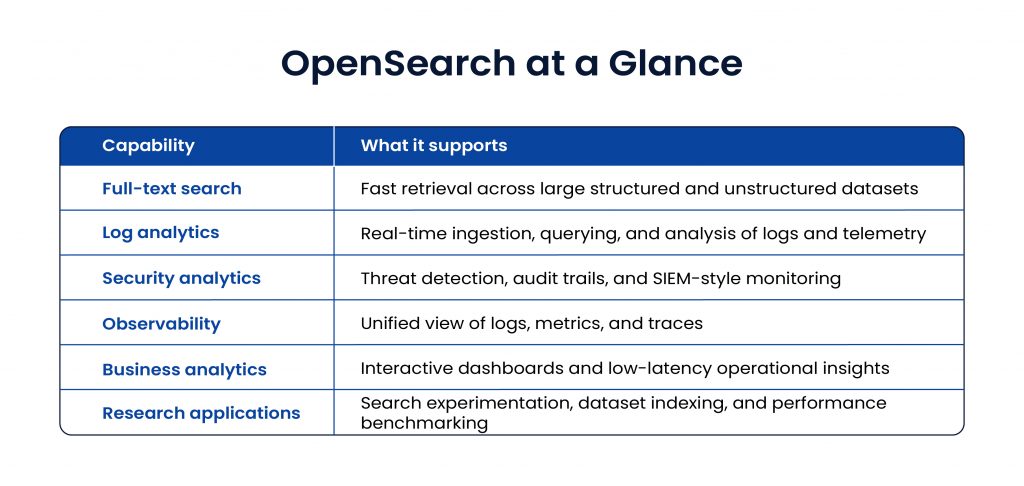
What Is OpenSearch?
OpenSearch is an open-source, distributed platform built for search, analytics, and observability. Managed by AWS and supported by the open-source community, it was created to offer a transparent and scalable alternative to proprietary search systems.
The platform combines indexing, query processing, machine learning, and visualization within one architecture. Its plugin-based design and compatibility with standard data formats make it suitable for a wide range of environments, from enterprise applications to large cloud-native systems.
Why OpenSearch Matters?
Modern systems generate large and varied data streams every second. Businesses need tools that can search documents, monitor infrastructure, detect threats, and analyze operational trends without relying on separate disconnected platforms.
OpenSearch addresses that need by bringing together several core functions:
- Search across large datasets
- Real-time analytics on streaming information
- Monitoring and observability for distributed systems
- Security event analysis and alerting
- Flexible deployment for enterprise and research environments
That makes it useful in both operational and strategic settings.
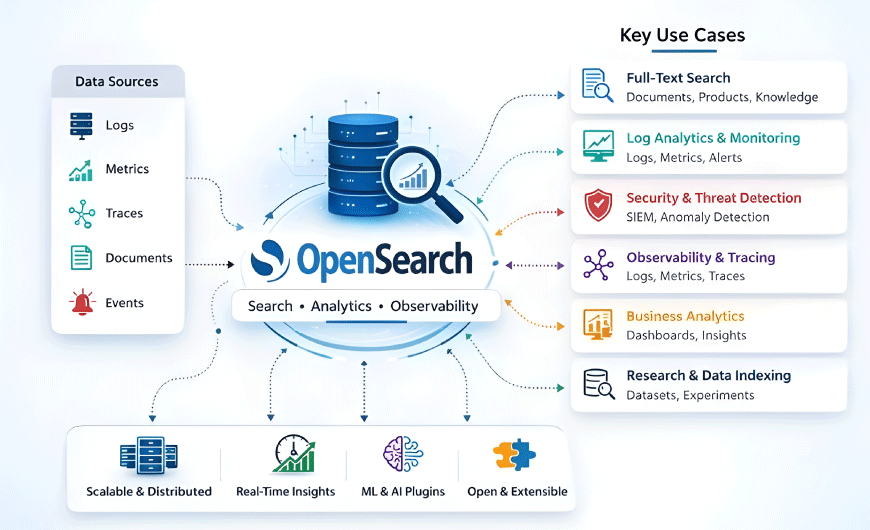
Key Use Cases of OpenSearch
OpenSearch supports far more than basic search. Its architecture makes it useful across monitoring, security, analytics, observability, and research-driven environments where speed, scale, and flexibility matter.
Full-Text Search and Information Retrieval
One of the strongest use cases of OpenSearch is high-performance full-text search. It uses inverted indexing and distributed search execution to retrieve results quickly, even across large datasets. Features such as tokenization, language analyzers, and relevance scoring allow teams to build precise and context-aware search experiences.
This is especially useful in the following scenarios:
- Enterprise knowledge repositories
Internal documents, support tickets, manuals, and knowledge bases often grow too large for basic search tools. OpenSearch improves findability by supporting semantic relevance and contextual query handling.
- E-commerce product search
Product catalogs need more than keyword matching. OpenSearch supports filters, facets, ranking logic, and personalization, which helps users find the right products faster.
- Digital libraries and academic archives
Large document collections demand both speed and accuracy. OpenSearch supports fast corpus exploration while maintaining low response times.
Another advantage is its extensible query framework. Teams can integrate neural ranking and hybrid search methods that combine keyword and semantic retrieval.
Log Aggregation and Operational Monitoring
OpenSearch is widely used for log analytics because it handles time-series data efficiently. Modern applications, cloud services, and distributed systems produce continuous streams of logs that must be collected, stored, and queried in near real time.
Common uses include:
- Centralized ingestion of application, network, and server logs
- Performance monitoring through metric analysis
- Automated alerting for unusual behavior
- Root-cause analysis across distributed environments
Its built-in anomaly detection capabilities help teams identify unusual patterns before they turn into larger issues. This makes OpenSearch valuable for DevOps teams, SRE functions, and organizations running microservices or cloud-native infrastructure.

Security Analytics and Threat Detection
OpenSearch also plays an important role in security operations. It can ingest and analyze events from authentication systems, firewalls, intrusion detection tools, and access control services. By correlating patterns across these data sources, organizations can build strong security monitoring workflows.
Key applications include:
- Detecting abnormal login or access behavior
- Identifying possible intrusion attempts
- Enriching threat data with intelligence pipelines
- Supporting compliance reporting and audit log retention
Because of this, OpenSearch is often used as the foundation for open SIEM implementations. It gives organizations a more flexible and vendor-neutral way to manage security analytics while reducing dependency on expensive licensing models.
Observability and Distributed Tracing
As systems become more distributed, teams need visibility across services, containers, APIs, and infrastructure layers. OpenSearch supports observability by bringing together logs, metrics, and traces in one environment.
When paired with OpenSearch Dashboards and Trace Analytics, and combined with OpenTelemetry instrumentation, it helps teams:
- Trace execution flows across microservices
- Analyze latency between service calls
- Identify performance bottlenecks
- Monitor Kubernetes and container workloads
This makes OpenSearch a practical choice for teams building resilient cloud platforms. It supports faster troubleshooting and gives engineers a clearer view of system behavior across complex architectures.
Business Analytics and Decision Intelligence
OpenSearch is not limited to technical monitoring. It also supports interactive analytics for business teams that need real-time visibility into operations and customer activity.
Its aggregations engine and fast query performance make it useful for:
- Streaming analytics in IoT and industrial systems
- Customer behavior analysis on digital platforms
- Operational dashboards without complex warehouse dependencies
- Low-latency reporting for time-sensitive decisions
Organizations can use OpenSearch to explore and visualize data without always moving it through heavy, multi-stage analytics pipelines. That gives teams faster access to insights and supports quicker response in operational settings.
Research and Scientific Computing
Because OpenSearch is open source and highly configurable, it is increasingly used in research and scientific computing. Academic institutions and technical teams value the ability to test, modify, and benchmark search systems in a reproducible way.
Typical research applications include:
- Indexing large scientific datasets
- Managing research corpora
- Testing ranking models
- Evaluating search relevance methods
- Benchmarking distributed query performance at scale
Its architecture allows researchers to work directly with search behavior and system performance. That creates room for experimentation in information retrieval, distributed systems, and large-scale analytics.
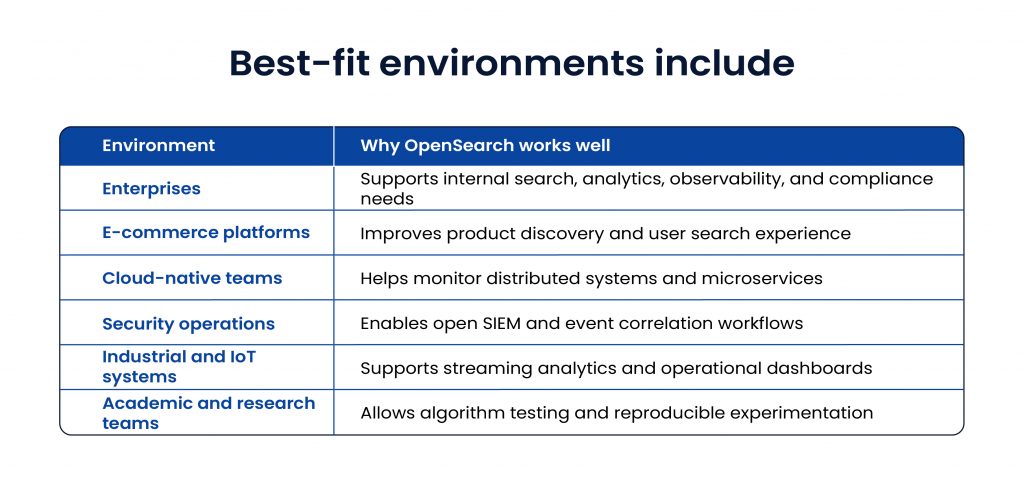
Where OpenSearch Fits Best?
The strength of OpenSearch lies in how broadly it can be applied. It is a strong fit for organizations that need one platform to support several data-heavy functions.
Core Benefits of OpenSearch
OpenSearch continues to gain adoption because it offers a practical mix of scale, flexibility, and visibility.
Key benefits include:
- Open-source governance with strong community support
- Distributed architecture for high scalability
- Extensible plugin ecosystem
- Unified support for search, analytics, and observability
- Compatibility across varied deployment environments
- Lower dependency on proprietary tooling
These advantages make it relevant for organizations that want both control and performance in their data systems.

Final Takeaway
OpenSearch has grown into a flexible platform for much more than search. It supports full-text retrieval, log analytics, security monitoring, observability, business intelligence, and research workloads in one scalable ecosystem.
For organizations working with growing volumes of operational and business data, OpenSearch offers a clear path to faster search, better visibility, and more responsive analytics. Its broad use across industry and research shows that it remains highly relevant in modern data-driven environments.
FAQs
What is OpenSearch mainly used for?
OpenSearch is mainly used for full-text search, log analytics, observability, security monitoring, and real-time data analysis. It helps organizations search large datasets and monitor systems from a single platform.
Is OpenSearch good for log analytics?
Yes, OpenSearch is widely used for log aggregation and log analytics. It can collect, store, query, and visualize logs from servers, applications, and cloud systems in near real time.
Can OpenSearch be used for observability?
Yes. OpenSearch supports observability by combining logs, metrics, and traces. With OpenSearch Dashboards and tracing tools, teams can monitor distributed systems and troubleshoot issues faster.
How does OpenSearch help with security analytics?
OpenSearch helps security teams analyze events from firewalls, authentication systems, and intrusion detection tools. It supports anomaly detection, event correlation, audit trails, and SIEM-style monitoring.
Is OpenSearch suitable for e-commerce search?
Yes, OpenSearch works well for e-commerce search because it supports filtering, faceting, relevance tuning, and personalized product discovery across large catalogs.
Can OpenSearch be used for business analytics?
Yes. OpenSearch supports low-latency analytics and interactive dashboards, which makes it useful for operational reporting, customer behavior analysis, and streaming data insights.
Why do research teams use OpenSearch?
Research teams use OpenSearch because it is open source, configurable, and suitable for testing ranking models, indexing large datasets, and benchmarking distributed search performance.
What are the benefits of OpenSearch over proprietary platforms?
OpenSearch offers open-source flexibility, lower licensing dependency, extensibility through plugins, and strong support for search, analytics, and observability in one system.


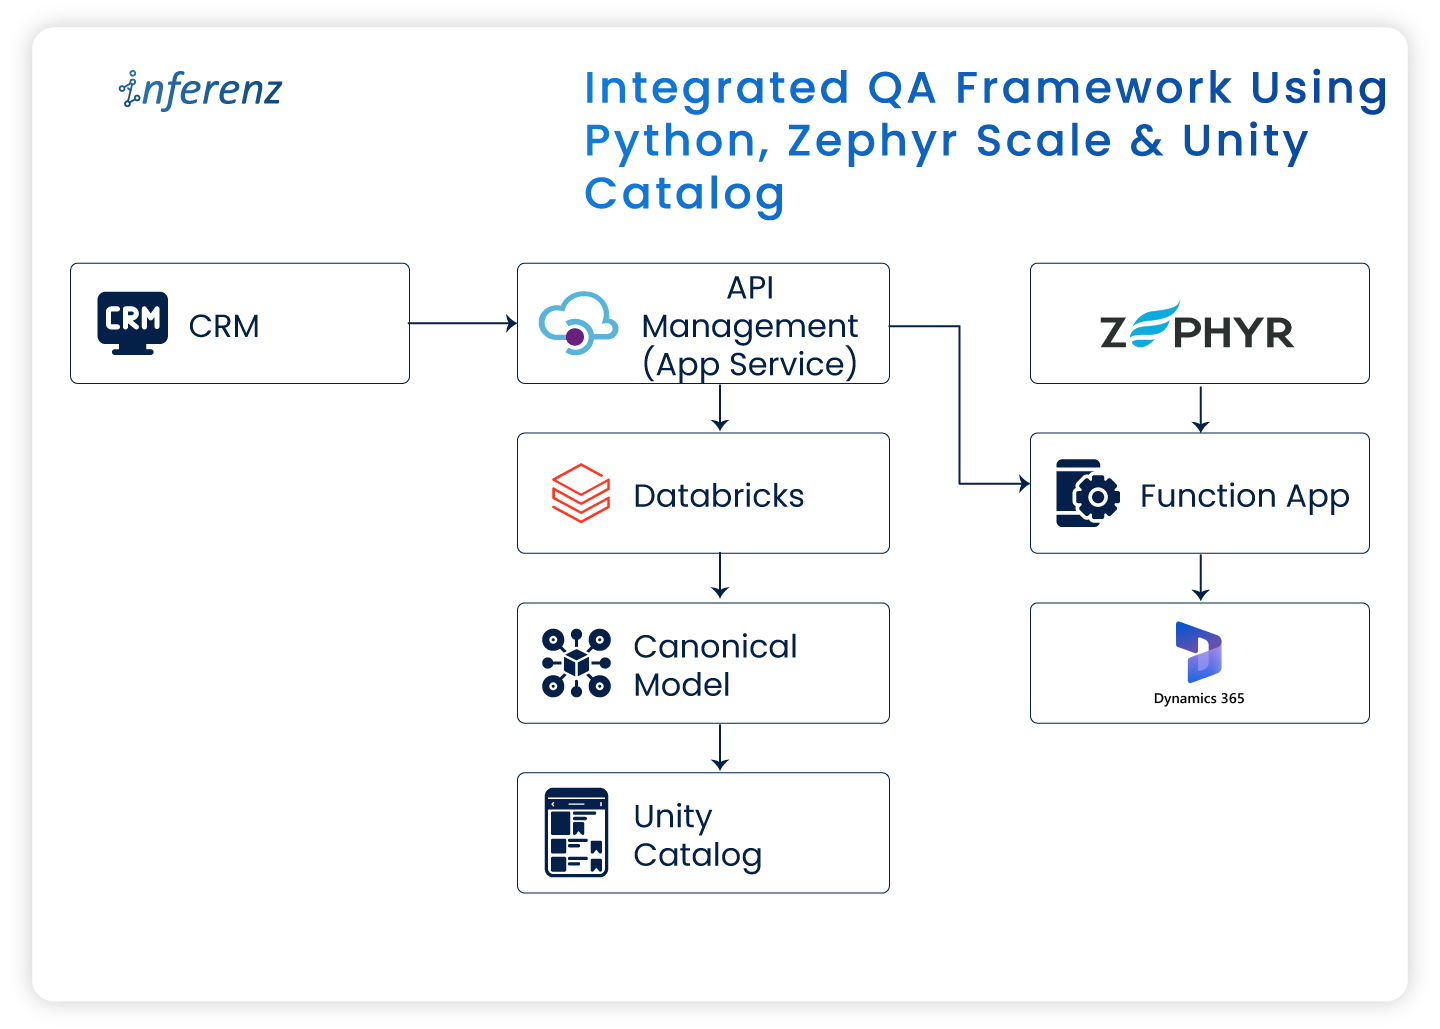 Integrated QA framework using Python, Zephyr Scale & Unity Catalog
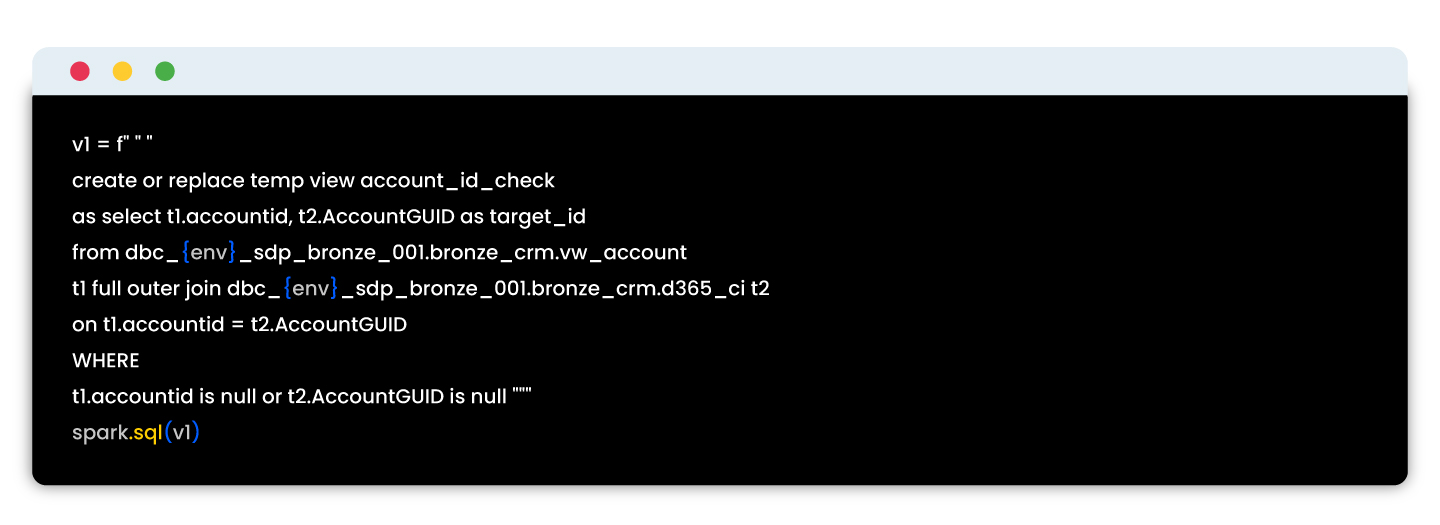


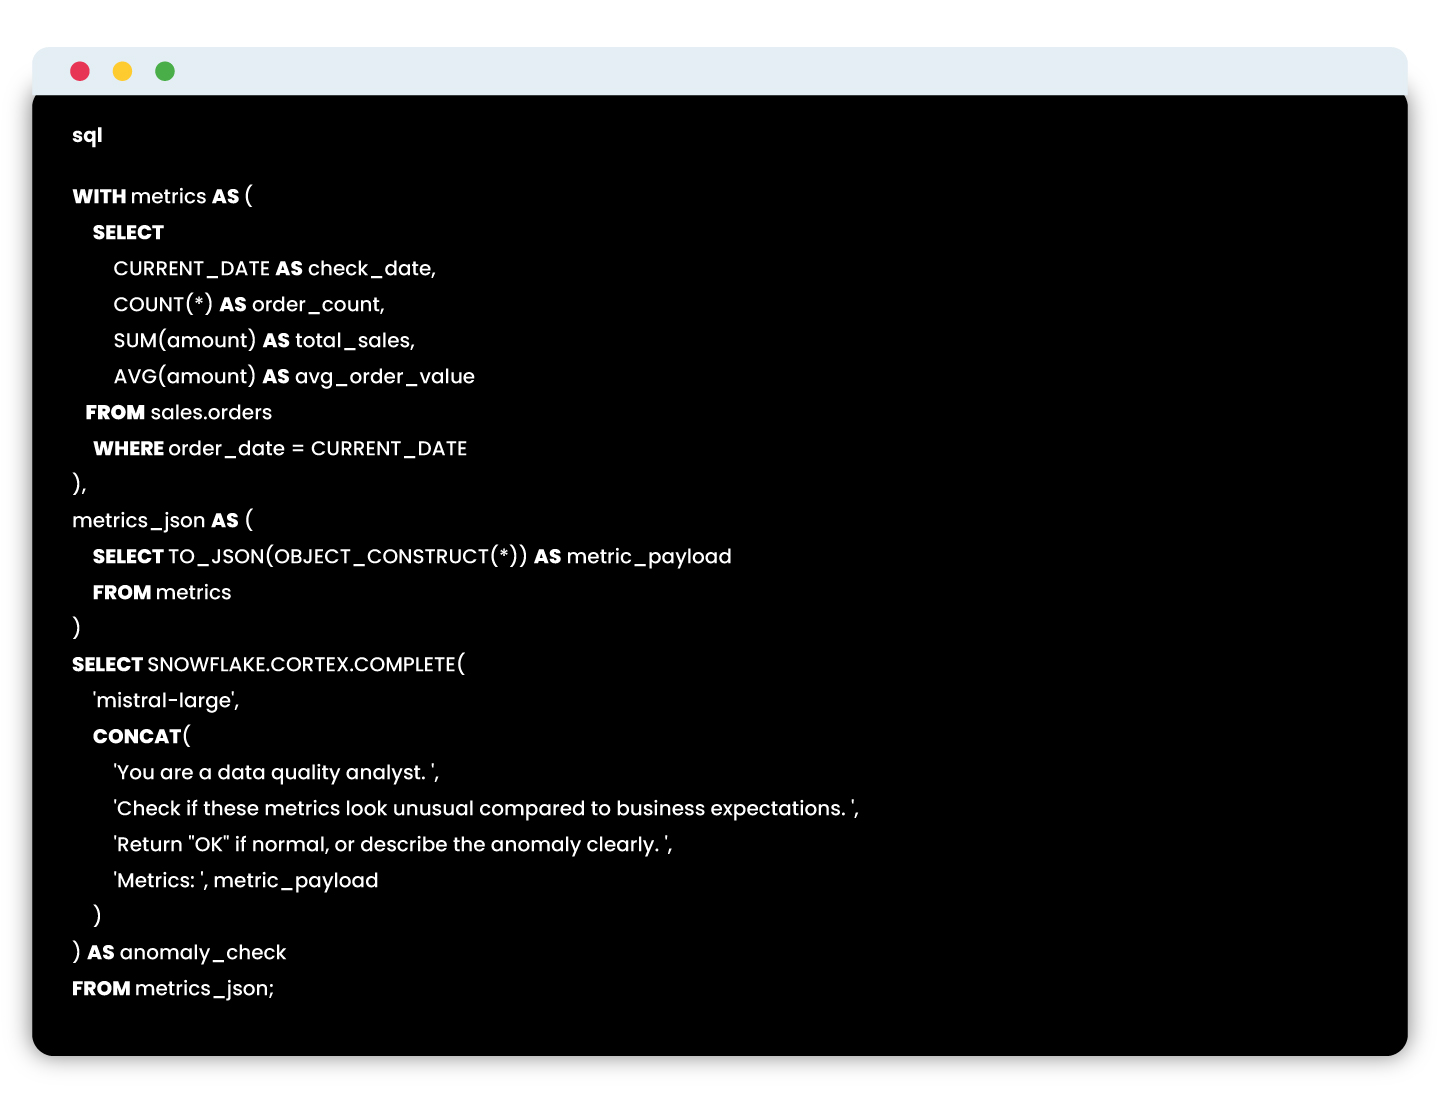
 Verify that your critical tables update as expected daily with timestamp comparisons.
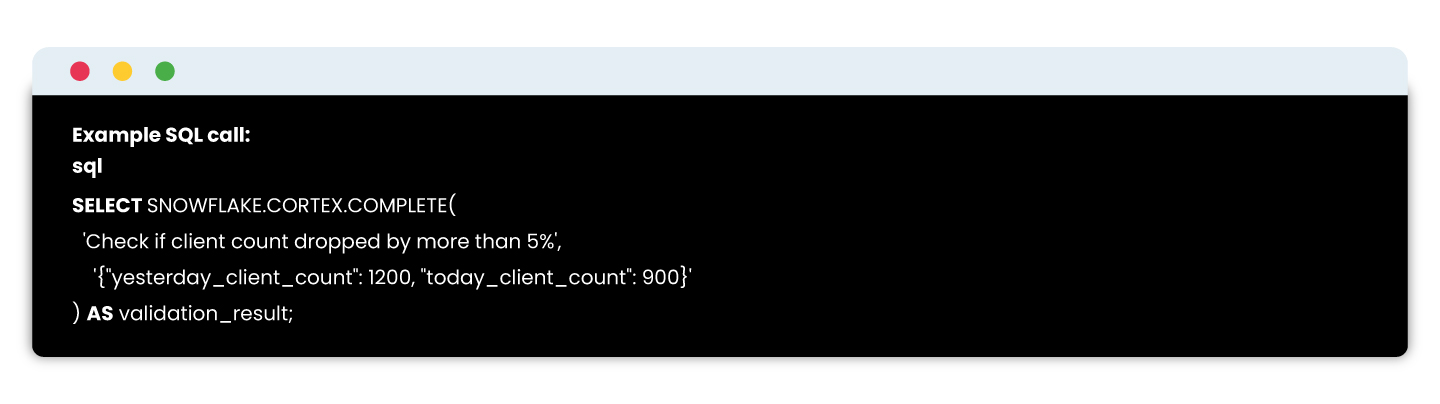 Snowflake Cortex enables embedding LLMs directly in SQL to evaluate complex data conditions naturally and intelligently.