













An audit-ready dashboard ties every compliance number to the patient record behind it. Learn what CMS and OIG reviewers check in 2026, which KPIs to track, and how to build the trail.
CMS now publishes provider-level hospice scores. The Service and Spending Variation Index uses nine claims-based measures, so a reviewer can spot your pattern before you’ve pulled a single record.
This article is the reporting step in our series on predictive analytics for hospice operations, written for CEOs and COOs who need an answer ready when a reviewer asks.
An audit-ready dashboard connects each compliance metric to the patient-level evidence behind it. For hospice care agencies, that means the hospice team can answer a record request from one screen. The sections below cover what to track, how to trace it, and where AI-powered automation for hospice fits.
What is an audit-ready dashboard in healthcare?
An audit-ready dashboard in healthcare is a reporting view where every tile opens to the patients, records, and rules behind the number. It carries a data cut date, a named owner, and a saved history. A reviewer can test it without asking your team to rebuild anything.
Summary dashboards show how you’re doing. Audit-ready dashboards show how you know. Continuous audit readiness means the dashboard holds that standard every month, including the months nobody is asking.
| Dimension | Summary dashboard | Audit-ready dashboard |
| What a tile shows | A percentage or a count | The percentage plus the list of patients behind it |
| Drill-down | Stops at the aggregate | Opens to the source record |
| Data cut date | Often missing | Printed on every tile |
| Definitions | Differ by team | One dictionary, versioned |
| History | Overwritten at each refresh | Monthly snapshots saved |
| Who it satisfies | The Monday meeting | The board, a reviewer, and a buyer |
What are CMS and its contractors reviewing in 2026?
Four pressures shape hospice reviews this year. Each calls for a different tile.
| Review pressure | What reviewers check | What your dashboard needs |
| Claims pattern analytics | The Service and Spending Variation Index (SSVI) scores utilization and non-hospice spending. Provider-level data is published, and a higher score signals potentially concerning patterns. | Your own monitoring of non-hospice spending and utilization by branch and patient, run before CMS publishes its next update. |
| Eligibility and certification records | Whether the chart supports a terminal prognosis and meets documentation rules. | Certification completeness, a clinician review queue, and a flag for admissions with no hospital or emergency visit in the prior 18 months. |
| HOPE quality reporting | At least 90% of HOPE records submitted within 30 days of admission, update visits, and discharge. | HOPE timeliness by branch and assessment type, with a countdown for records approaching day 30. |
| Billing compliance samples | A sample of claims, such as OIG’s 100-claim samples, tested against Medicare rules. | Sampled claim accuracy by branch and error type, plus policy adherence. |
The numbers behind these rows are specific. In FY 2026, 20.37% of hospices missed the HOPE reporting requirement, and the FY 2027 final rule adds a Care Compare icon for them, effective no earlier than FY 2028. Missing the requirement also cuts the payment update by four percentage points, which turns a 2.3% increase into a 1.7% reduction.
The same rule makes the election statement addendum mandatory for every beneficiary who elects hospice. Before, hospices issued it on request. That adds a yes-or-no field to every election, and a reviewer can check all of them.
Record-level review has teeth too. In a June 2026 audit, OIG reviewed 100 initial certification periods for new hospice enrollees and found that 45 did not meet Medicare requirements. In 21, the medical record did not support a terminal illness. In 24, the documentation requirements went unmet. OIG flagged new enrollees with no inpatient or emergency room claims in the prior 18 months as a high-risk group, estimated Medicare could have saved $255.1 million, and CMS concurred with its recommendation.
Why do dashboards that look fine internally fail when reviewers ask for patient-level evidence?
A rate can’t answer a records request. Reviewers sample patients, and a summary tile doesn’t say which patients sit behind it.
Sampling also multiplies small errors. In a July 2026 audit, OIG tested 100 claims from Hospice of the Valley West and found 15 non-compliant, worth $69,184 in overpayments over a two-year audit period. From that sample, OIG estimated at least $8.6 million in unallowable payments out of $86 million paid. The errors occurred primarily because the hospice did not always follow its own policies and procedures.
A dashboard that reports 94% compliance says nothing about which 6% failed or why. Three gaps cause most of the trouble:
- No patient list behind the percentage, so nobody can find the failures.
- No as-of date, so the number can’t be reproduced for a past period.
- Definitions that differ from billing, so a reviewer who recomputes the metric gets a different answer.
One distinction matters for the OIG findings. A dashboard can automate completeness checks, such as whether a signature, a date, and a narrative exist. It can’t judge whether the narrative supports the prognosis. Build a clinician review queue for that second test and log who reviewed which record.
What KPIs should a hospice compliance dashboard include?
A healthcare compliance KPI dashboard works when each KPI has a definition, a source, and a reason a reviewer would ask about it. Ten KPIs cover the pressures above.
| KPI | Definition | Source | Why a reviewer cares |
| HOPE on-time rate | Records accepted within 30 days (admission, update visit, discharge). Aim above 90%. | iQIES, EHR | CMS threshold. Icon on Care Compare from FY 2028 at the earliest. |
| Certification completeness | Periods with signed certification, narrative, and required elements before the claim. | EHR, billing | OIG found 45 of 100 periods deficient. |
| Narrative review rate | Certification narratives reviewed by a clinician against the prognosis. | EHR review log | Tests clinical support as well as completeness. |
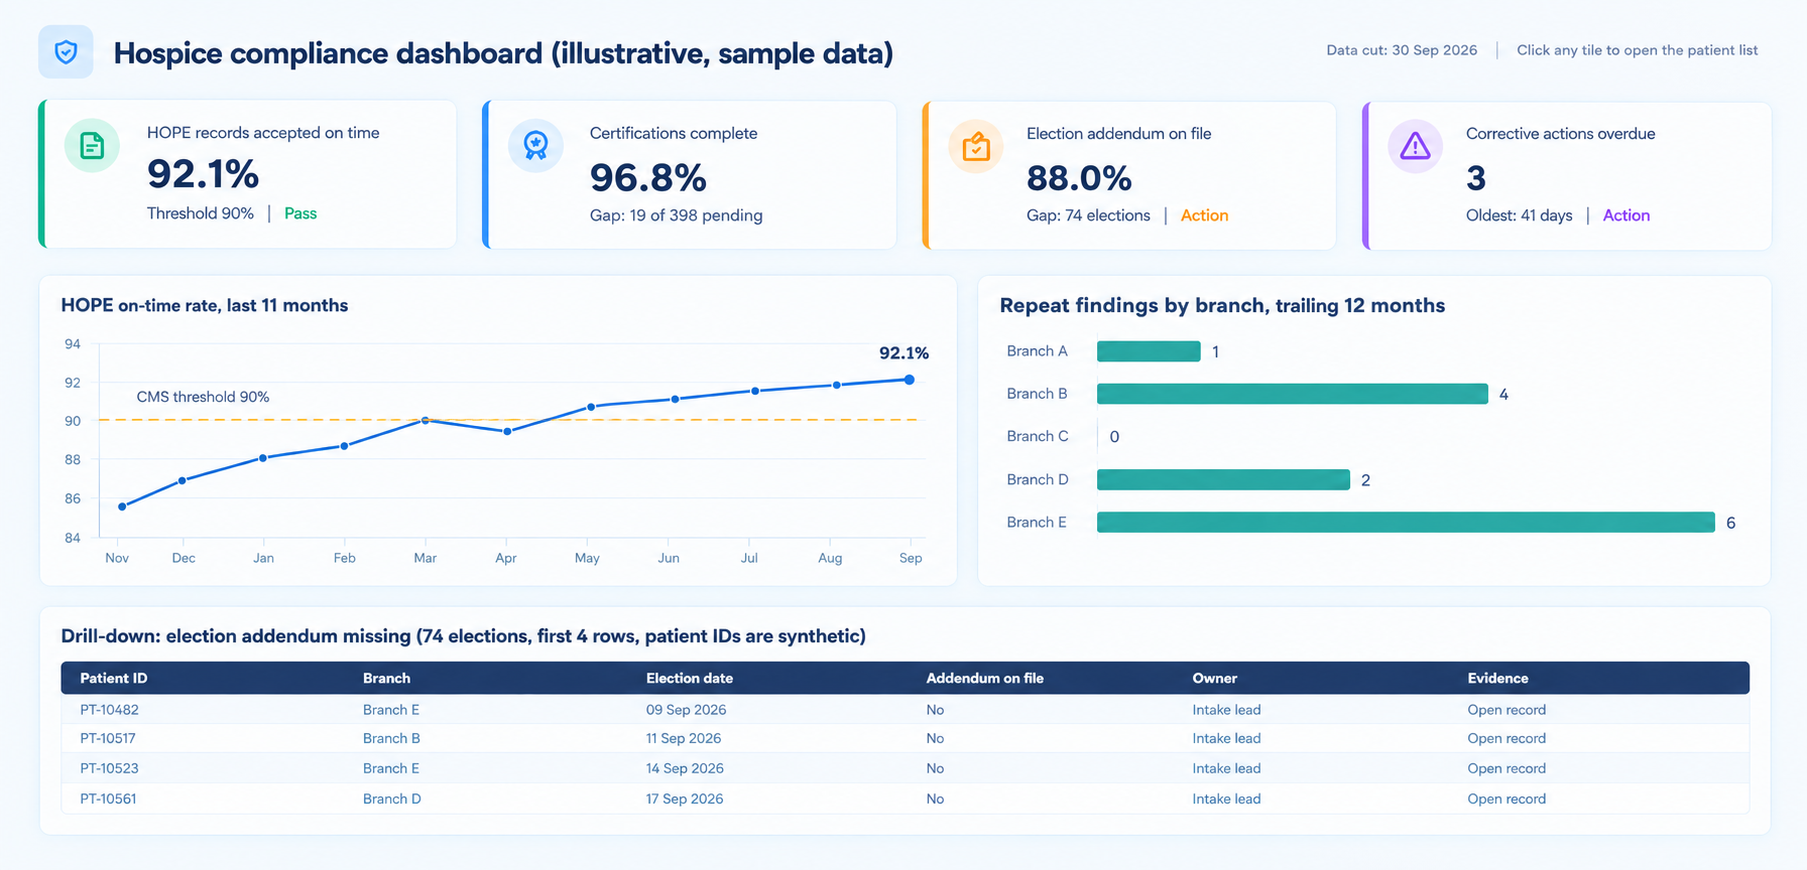
| Election addendum on file | Elections with the addendum delivered at election. | EHR | Mandatory for every election under the FY 2027 rule. |
| Non-hospice spending | Medicare spending outside hospice for patients on service, by branch. | Claims | A core concern behind the SSVI. |
| Live discharges | Rate and reason mix by branch. | EHR, claims | Unusual patterns draw questions. |
| Aggregate cap position | Projected payments against allowance. The FY 2027 cap is $36,174.75 per beneficiary. | Claims, PS&R | Ties the dashboard to the forecast. |
| Corrective action closure | Share closed on time, items reopened, repeat findings. | Action register | Shows whether fixes hold. |
| Policy adherence | Sampled records that follow your own policy. | Mock audit | Policy gaps drove the Hospice of the Valley West errors. |
| Evidence retrieval time | Hours to assemble a full record set for one sampled patient. | Mock audit | Reveals how scattered your evidence is. |
The last four rows serve as compliance program effectiveness metrics. They answer whether the program works, which differs from whether policies exist.
How do you make every dashboard number traceable to source data?
Give every tile a five-link chain. A reviewer should be able to walk it from the headline number to the document that proves it.
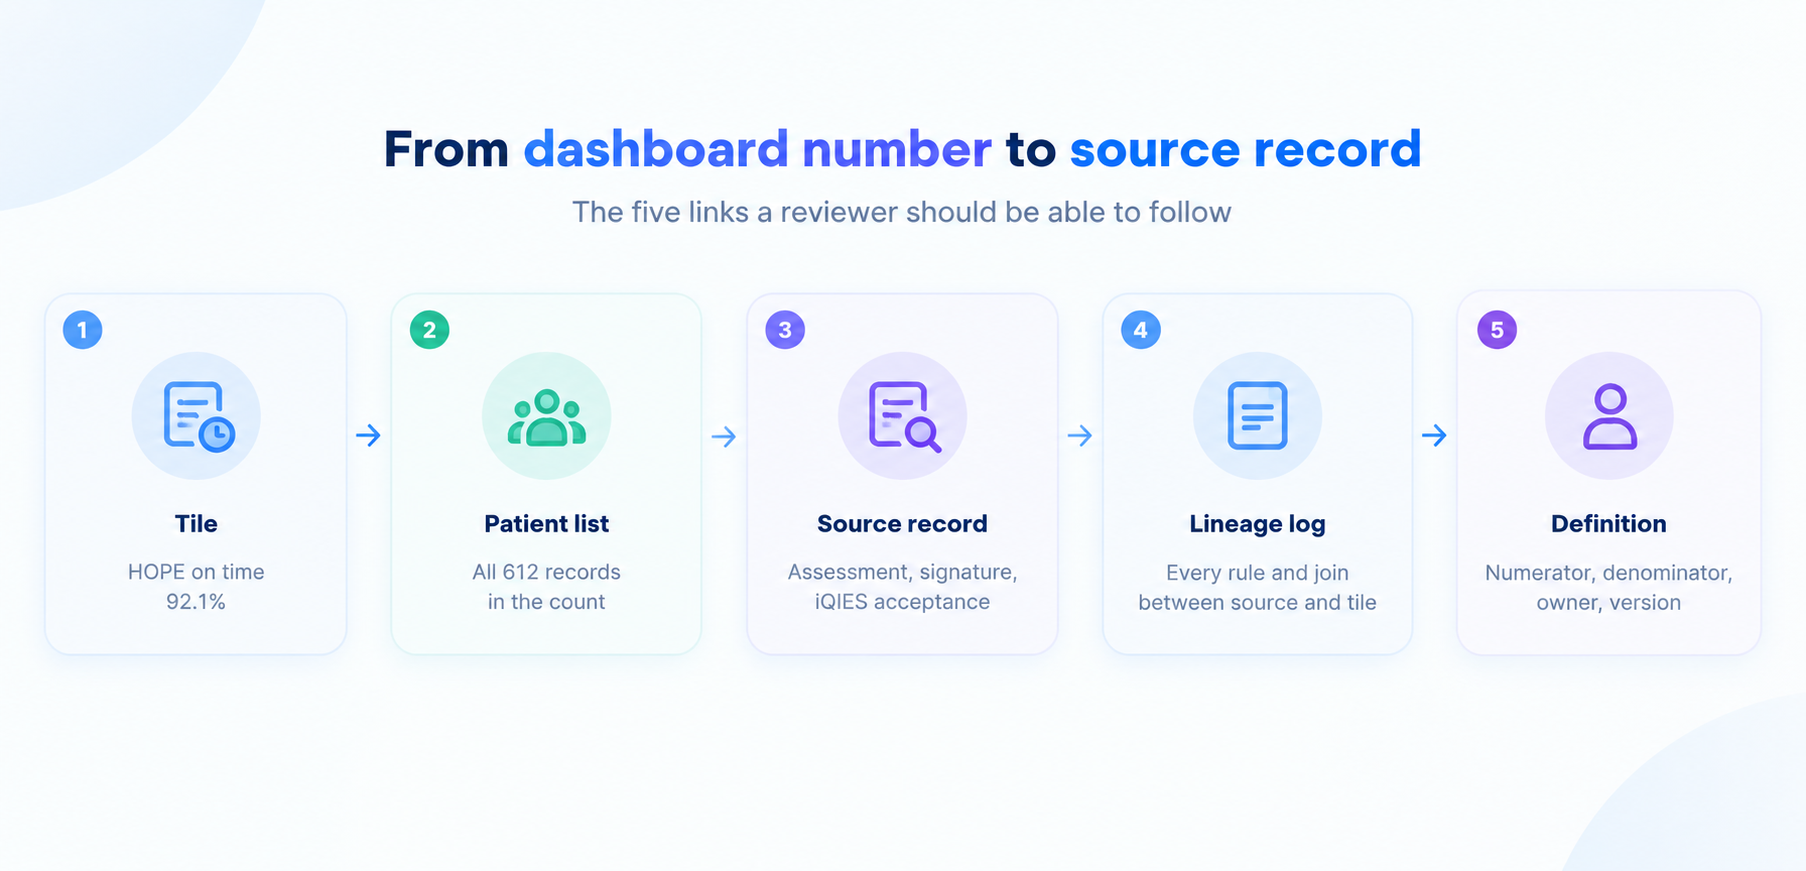
- Tile: the headline number with its as-of date.
- Patient list: every record counted, with exclusions listed separately.
- Source record: the assessment, signature, claim, or iQIES acceptance that proves the status.
- Lineage log: each rule, join, and correction between the source system and the tile.
- Definition: numerator, denominator, owner, and version.
The chain starts at referral intake, what vendors call the digital front door in healthcare, because election and certification paperwork begins there.
Data lineage behind dashboard metrics is the fourth link, and reviewers find it the hardest to improvise. Our guide to audit-ready data lineage shows how to record it without replacing your current systems.
Tracing doesn’t have to slow reporting. Store the patient-level detail table beside each aggregate in the gold layer and refresh both on the same schedule. Drill-down becomes a query, with no project attached.
What is the difference between a compliance dashboard and an audit-ready evidence system?
A compliance dashboard tells operations what to fix this week. An evidence system proves what was true on a given date. Reviewers ask the second question, usually about a period that closed months ago.
Point-in-time vs real-time compliance view
| Dimension | Real-time compliance view | Point-in-time evidence snapshot |
| Question answered | What needs attention today? | What was true on the date of service or submission? |
| Refresh | Continuous or daily | Frozen monthly and at each submission |
| Audience | Branch managers and the compliance lead | Reviewers, the board, and buyers |
| Main risk | Numbers change under you | Goes stale without a live view beside it |
| Best for | Operational fixes | Record requests and mock audits |
Run both. Freeze a snapshot at month end, store the inputs and the rules, and let the live view keep working. The live view catches problems, and the snapshot proves the past. Together they deliver audit-ready reporting for CMS reviews.
How should hospices track corrective action plans so repeat findings don’t become systemic?
Treat every finding as a record with an owner and a clock. A corrective action plan monitoring dashboard should pull findings from every source: internal audits, contractor letters, OIG recommendations, and survey results.
- Log the finding with its source, date, and the records affected.
- Name the root cause category, such as training, workflow, system, or policy.
- Assign one owner and a due date.
- Attach proof of the fix, such as a changed workflow or a retraining roster.
- Retest at 30, 60, and 90 days on a fresh sample and record the result.
Show open items by age, overdue items, reopened items, and repeat findings by branch and root cause. The Hospice of the Valley West report shows what the retest step guards against. Among its recommendations, OIG suggested internal audits of later claims to find similar overpayments and added training for clinical staff on validating the terminal prognosis.
How do multi-site hospices run one compliance view across branches and contracted providers?
A multi-site compliance dashboard works only when every branch uses the same definitions. Roll up to the organization, then let a leader click down to a branch, a team, and a patient. A branch with six repeat findings beside a branch with none shows where to look first.
Where contracted providers fit
Contracted providers belong on the same screen. Hospices keep professional management responsibility for care delivered under contract, so track credential currency, contract review dates, and any findings tied to those providers in the same register.
How early should a hospice run a mock audit?
Run one every quarter and run the first before you need it. A mock audit pulls a sample, tests whether the hospice team can assemble each record, and checks three things: whether the narrative supports the prognosis, whether certifications were complete before the claim, and whether the addendum reached the family at election.
Validate the record population first
Reconcile patient, claim, and day counts between clinical and billing systems each month, so the numbers tie before anyone asks. As a starting point, try 25 records per branch each quarter, then adjust to your risk. OIG’s 2026 audits each reviewed a sample of 100, so test your own records the same way.
Where do AI in hospice care and automation fit in an audit-ready dashboard?
AI in hospice care earns a place on the compliance side when it takes over repetitive checking and leaves judgment with clinicians. AI-powered automation for hospice can run these jobs every night:
- Reconcile HOPE records against iQIES acceptance.
- Flag missing addenda and incomplete certifications on the day they occur.
- Assemble the evidence pack for a sampled patient from the five-link chain.
- Draft the corrective action entry for a steward to review.
Keep a human at the final decision. Log each AI suggestion, the reviewer, the decision, and the timestamp, so the dashboard can show that a clinician confirmed eligibility and signed the certification. Reviewers ask who decided, and the log answers.
Should you buy an audit management platform or build on your existing data stack?
Both paths work. The test is whether the tool meets the standard above. Ask every option these six questions:
- Does every tile open to a patient list?
- Does it save dated snapshots?
- Can it export a reviewer-ready evidence pack?
- Can your clinicians edit rules without a developer ticket?
- Does it restrict PHI access by role?
- Does it log automated suggestions and human decisions?
Teams with a governed data layer often build on it, because the lineage already exists. Smaller teams may buy. Vendors that sell value based care software or quality reporting tools now add compliance modules, so ask each one to demonstrate the checklist on your own records. For in-house builds, a data partner offering business intelligence and visualization services can shorten the work.
How do you explain dashboard methodology to a board, an auditor, and a regulator in one document?
Write one metric card per KPI. Each card lists the definition, numerator, denominator, source system, owner, refresh time, version, and known limits. The board reads the headline and the trend, the auditor reads the definition and source, and the regulator reads the lineage appendix. One document serves all three at different depths.
A 90-day plan for your hospice team
- Days 1 to 30: Name an owner for each KPI, write the metric cards, and list where certification, election, and HOPE evidence lives.
- Days 31 to 60: Build patient-level drill-down for the top five KPIs and start monthly snapshots.
- Days 61 to 90: Run the first mock audit, open the corrective action register, and review results with your board or compliance committee.
Final Thoughts
Reviewers ask which patients are in the number. If your hospice team can answer from one screen, a CMS review becomes a records exercise your team has already rehearsed.
Start with the five-link chain for one KPI, HOPE timeliness, since the 90% threshold gives you a clear pass line. Add certifications next, then the election addendum.